OswalGreentech OSWALGREEN full analysis,charts,indicators,moving averages,SMA,DMA,EMA,ADX,MACD,RSIOswal Greentech OSWALGREEN WideScreen charts, DMA,SMA,EMA technical analysis, forecast prediction, by indicators ADX,MACD,RSI,CCI NSE stock exchange
Daily price and charts and targets OswalGreentech Strong Daily Stock price targets for OswalGreentech OSWALGREEN are 36.71 and 37.68 | Daily Target 1 | 36.48 | | Daily Target 2 | 36.93 | | Daily Target 3 | 37.45 | | Daily Target 4 | 37.9 | | Daily Target 5 | 38.42 |
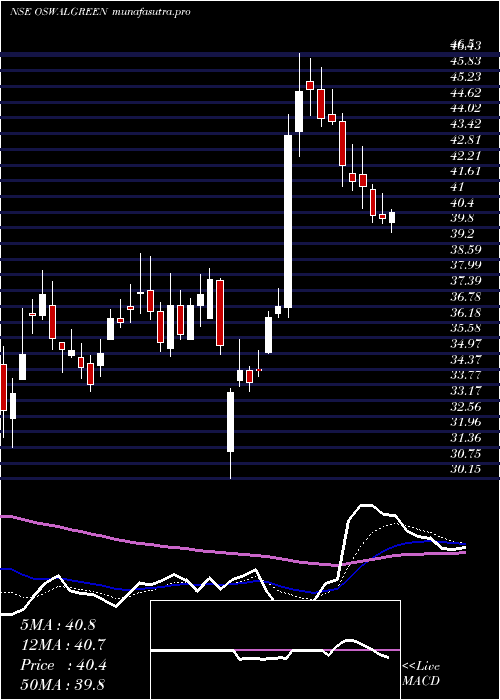
Daily price and volume Oswal Greentech
| Date |
Closing |
Open |
Range |
Volume |
Tue 28 October 2025 |
37.38 (-0.98%) |
37.75 |
37.00 - 37.97 |
1.6095 times |
Mon 27 October 2025 |
37.75 (-0.68%) |
38.20 |
37.70 - 38.42 |
0.7562 times |
Fri 24 October 2025 |
38.01 (-0.99%) |
38.50 |
37.90 - 38.60 |
0.9034 times |
Thu 23 October 2025 |
38.39 (-0.29%) |
38.55 |
38.25 - 39.90 |
1.2804 times |
Tue 21 October 2025 |
38.50 (0.68%) |
38.99 |
38.20 - 39.00 |
0.2353 times |
Mon 20 October 2025 |
38.24 (0.53%) |
38.02 |
38.00 - 38.74 |
0.7678 times |
Fri 17 October 2025 |
38.04 (-1.96%) |
39.17 |
37.76 - 39.17 |
1.5681 times |
Thu 16 October 2025 |
38.80 (0.39%) |
38.65 |
38.65 - 39.50 |
0.6804 times |
Wed 15 October 2025 |
38.65 (0.39%) |
38.80 |
38.36 - 39.28 |
0.8142 times |
Tue 14 October 2025 |
38.50 (-1.74%) |
39.39 |
38.12 - 39.73 |
1.3846 times |
Mon 13 October 2025 |
39.18 (-2.05%) |
40.00 |
38.77 - 40.00 |
1.1098 times |
Weekly price and charts OswalGreentech Strong weekly Stock price targets for OswalGreentech OSWALGREEN are 36.48 and 37.9 | Weekly Target 1 | 36.18 | | Weekly Target 2 | 36.78 | | Weekly Target 3 | 37.6 | | Weekly Target 4 | 38.2 | | Weekly Target 5 | 39.02 |
Weekly price and volumes for Oswal Greentech
| Date |
Closing |
Open |
Range |
Volume |
Tue 28 October 2025 |
37.38 (-1.66%) |
38.20 |
37.00 - 38.42 |
0.2446 times |
Fri 24 October 2025 |
38.01 (-0.08%) |
38.02 |
37.90 - 39.90 |
0.3295 times |
Fri 17 October 2025 |
38.04 (-4.9%) |
40.00 |
37.76 - 40.00 |
0.5746 times |
Fri 10 October 2025 |
40.00 (-2.27%) |
40.51 |
38.55 - 41.16 |
0.5009 times |
Fri 03 October 2025 |
40.93 (8.02%) |
38.66 |
37.30 - 43.79 |
6.0915 times |
Fri 26 September 2025 |
37.89 (-7.59%) |
40.97 |
37.55 - 41.00 |
0.4275 times |
Fri 19 September 2025 |
41.00 (3.12%) |
39.62 |
39.62 - 41.90 |
0.4715 times |
Fri 12 September 2025 |
39.76 (-1.05%) |
40.20 |
39.50 - 41.16 |
0.45 times |
Fri 05 September 2025 |
40.18 (0.4%) |
40.02 |
40.02 - 42.10 |
0.4677 times |
Fri 29 August 2025 |
40.02 (-6.06%) |
42.67 |
39.90 - 43.09 |
0.4422 times |
Fri 22 August 2025 |
42.60 (2.16%) |
42.00 |
41.50 - 43.15 |
0.631 times |

Monthly price and charts OswalGreentech Strong monthly Stock price targets for OswalGreentech OSWALGREEN are 34.44 and 39.94 | Monthly Target 1 | 33.46 | | Monthly Target 2 | 35.42 | | Monthly Target 3 | 38.96 | | Monthly Target 4 | 40.92 | | Monthly Target 5 | 44.46 |
Monthly price and volumes Oswal Greentech
| Date |
Closing |
Open |
Range |
Volume |
Tue 28 October 2025 |
37.38 (-8.98%) |
41.40 |
37.00 - 42.50 |
0.3863 times |
Tue 30 September 2025 |
41.07 (2.62%) |
40.02 |
37.30 - 43.79 |
1.206 times |
Fri 29 August 2025 |
40.02 (-6.32%) |
43.15 |
39.90 - 46.99 |
0.7255 times |
Thu 31 July 2025 |
42.72 (-6.5%) |
45.99 |
42.55 - 48.31 |
0.7304 times |
Mon 30 June 2025 |
45.69 (12.23%) |
40.99 |
40.15 - 50.90 |
2.763 times |
Fri 30 May 2025 |
40.71 (1.12%) |
40.30 |
35.50 - 43.88 |
0.6185 times |
Wed 30 April 2025 |
40.26 (12.8%) |
35.51 |
30.15 - 46.50 |
1.49 times |
Fri 28 March 2025 |
35.69 (3.51%) |
34.54 |
31.36 - 38.80 |
0.5541 times |
Fri 28 February 2025 |
34.48 (-25.75%) |
46.20 |
33.80 - 48.00 |
0.4292 times |
Fri 31 January 2025 |
46.44 (-2.05%) |
47.60 |
42.90 - 53.10 |
1.097 times |
Tue 31 December 2024 |
47.41 (-6.82%) |
50.99 |
46.50 - 57.37 |
1.5853 times |

DMA SMA EMA moving averages of Oswal Greentech OSWALGREEN
DMA (daily moving average) of Oswal Greentech OSWALGREEN
| DMA period | DMA value | | 5 day DMA | 38.01 | | 12 day DMA | 38.45 | | 20 day DMA | 39.03 | | 35 day DMA | 39.52 | | 50 day DMA | 40.05 | | 100 day DMA | 42.69 | | 150 day DMA | 41.65 | | 200 day DMA | 41.79 | EMA (exponential moving average) of Oswal Greentech OSWALGREEN
| EMA period | EMA current | EMA prev | EMA prev2 | | 5 day EMA | 37.88 | 38.13 | 38.32 | | 12 day EMA | 38.4 | 38.58 | 38.73 | | 20 day EMA | 38.82 | 38.97 | 39.1 | | 35 day EMA | 39.5 | 39.62 | 39.73 | | 50 day EMA | 40.09 | 40.2 | 40.3 |
SMA (simple moving average) of Oswal Greentech OSWALGREEN
| SMA period | SMA current | SMA prev | SMA prev2 | | 5 day SMA | 38.01 | 38.18 | 38.24 | | 12 day SMA | 38.45 | 38.66 | 38.78 | | 20 day SMA | 39.03 | 39.05 | 39.15 | | 35 day SMA | 39.52 | 39.6 | 39.7 | | 50 day SMA | 40.05 | 40.14 | 40.23 | | 100 day SMA | 42.69 | 42.75 | 42.82 | | 150 day SMA | 41.65 | 41.64 | 41.62 | | 200 day SMA | 41.79 | 41.83 | 41.88 |
|
|
