OswalAgro OSWALAGRO full analysis,charts,indicators,moving averages,SMA,DMA,EMA,ADX,MACD,RSIOswal Agro OSWALAGRO WideScreen charts, DMA,SMA,EMA technical analysis, forecast prediction, by indicators ADX,MACD,RSI,CCI NSE stock exchange
operates under Investment Companies sector
Daily price and charts and targets OswalAgro Strong Daily Stock price targets for OswalAgro OSWALAGRO are 73.56 and 74.98 | Daily Target 1 | 72.42 | | Daily Target 2 | 73.27 | | Daily Target 3 | 73.843333333333 | | Daily Target 4 | 74.69 | | Daily Target 5 | 75.26 |
Daily price and volume Oswal Agro
| Date |
Closing |
Open |
Range |
Volume |
Wed 29 October 2025 |
74.11 (1.33%) |
73.00 |
73.00 - 74.42 |
0.4775 times |
Tue 28 October 2025 |
73.14 (-2.11%) |
74.99 |
72.51 - 74.99 |
0.7549 times |
Mon 27 October 2025 |
74.72 (-0.45%) |
75.99 |
74.50 - 76.48 |
0.8741 times |
Fri 24 October 2025 |
75.06 (3.76%) |
71.72 |
71.72 - 76.50 |
2.7431 times |
Thu 23 October 2025 |
72.34 (1.36%) |
71.90 |
71.70 - 74.52 |
2.1705 times |
Tue 21 October 2025 |
71.37 (-0.01%) |
70.80 |
70.25 - 71.95 |
0.2365 times |
Mon 20 October 2025 |
71.38 (1.13%) |
73.00 |
70.80 - 73.00 |
0.3909 times |
Fri 17 October 2025 |
70.58 (-1.92%) |
73.49 |
69.80 - 73.78 |
0.9423 times |
Thu 16 October 2025 |
71.96 (1.47%) |
71.69 |
71.30 - 73.99 |
0.7473 times |
Wed 15 October 2025 |
70.92 (1.55%) |
70.70 |
70.00 - 71.63 |
0.6629 times |
Tue 14 October 2025 |
69.84 (-1.7%) |
71.70 |
68.80 - 71.70 |
1.2442 times |
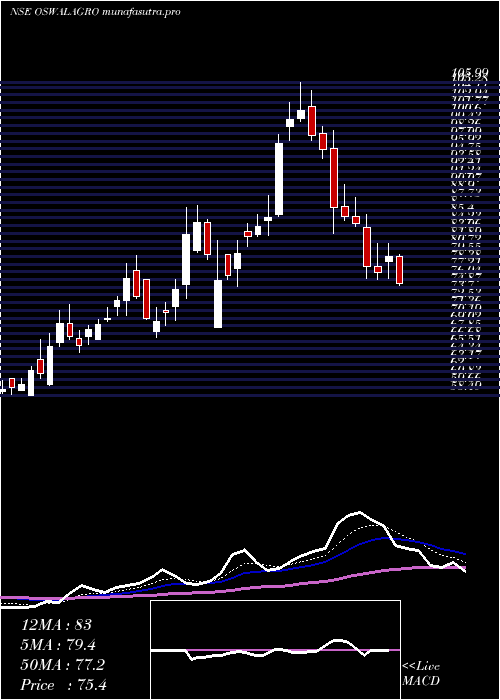
Weekly price and charts OswalAgro Strong weekly Stock price targets for OswalAgro OSWALAGRO are 71.33 and 75.3 | Weekly Target 1 | 70.4 | | Weekly Target 2 | 72.25 | | Weekly Target 3 | 74.366666666667 | | Weekly Target 4 | 76.22 | | Weekly Target 5 | 78.34 |
Weekly price and volumes for Oswal Agro
| Date |
Closing |
Open |
Range |
Volume |
Wed 29 October 2025 |
74.11 (-1.27%) |
75.99 |
72.51 - 76.48 |
0.3402 times |
Fri 24 October 2025 |
75.06 (6.35%) |
73.00 |
70.25 - 76.50 |
0.8949 times |
Fri 17 October 2025 |
70.58 (-2.08%) |
71.10 |
68.80 - 73.99 |
0.6641 times |
Fri 10 October 2025 |
72.08 (-4.9%) |
75.79 |
71.60 - 78.00 |
0.7616 times |
Fri 03 October 2025 |
75.79 (5.85%) |
71.90 |
69.12 - 76.65 |
1.3482 times |
Fri 26 September 2025 |
71.60 (-5.25%) |
75.15 |
71.05 - 76.25 |
0.619 times |
Fri 19 September 2025 |
75.57 (-2.58%) |
77.77 |
75.40 - 78.90 |
0.8274 times |
Fri 12 September 2025 |
77.57 (3.76%) |
75.09 |
73.78 - 79.95 |
1.5796 times |
Fri 05 September 2025 |
74.76 (-4.31%) |
78.63 |
73.55 - 79.99 |
1.2672 times |
Fri 29 August 2025 |
78.13 (-1.46%) |
80.03 |
77.10 - 82.80 |
1.6976 times |
Fri 22 August 2025 |
79.29 (8.2%) |
74.55 |
73.30 - 83.44 |
2.3887 times |
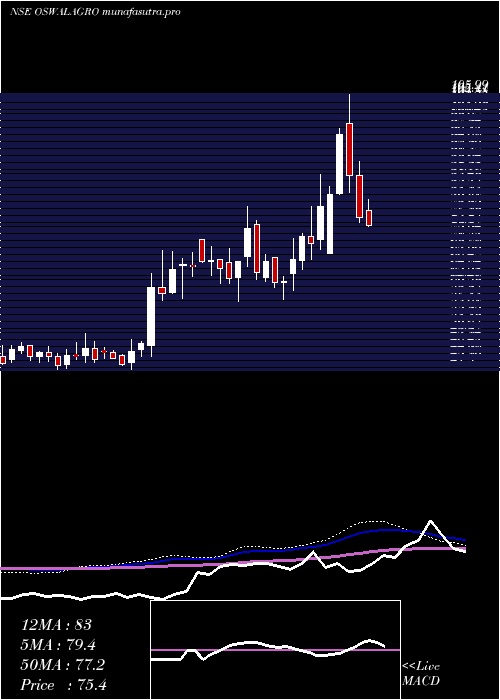
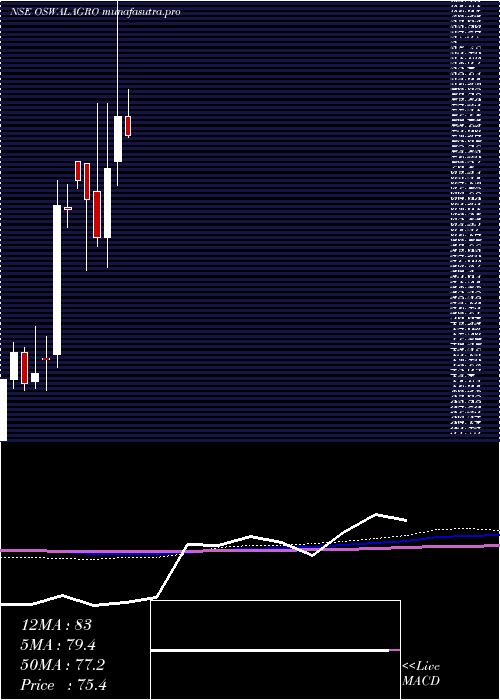
Monthly price and charts OswalAgro Strong monthly Stock price targets for OswalAgro OSWALAGRO are 66.86 and 76.06 | Monthly Target 1 | 64.44 | | Monthly Target 2 | 69.27 | | Monthly Target 3 | 73.636666666667 | | Monthly Target 4 | 78.47 | | Monthly Target 5 | 82.84 |
Monthly price and volumes Oswal Agro
| Date |
Closing |
Open |
Range |
Volume |
Wed 29 October 2025 |
74.11 (0.35%) |
75.50 |
68.80 - 78.00 |
0.2432 times |
Tue 30 September 2025 |
73.85 (-5.48%) |
78.63 |
69.12 - 79.99 |
0.3992 times |
Fri 29 August 2025 |
78.13 (0.76%) |
77.93 |
72.53 - 93.39 |
1.7404 times |
Thu 31 July 2025 |
77.54 (-13.46%) |
90.93 |
76.59 - 90.93 |
0.8054 times |
Mon 30 June 2025 |
89.60 (6.09%) |
84.89 |
83.56 - 110.80 |
3.3958 times |
Fri 30 May 2025 |
84.46 (8.24%) |
78.00 |
73.15 - 101.99 |
1.3419 times |
Wed 30 April 2025 |
78.03 (9.81%) |
72.00 |
68.81 - 105.99 |
1.4897 times |
Fri 28 March 2025 |
71.06 (14.78%) |
61.91 |
57.92 - 79.70 |
0.2067 times |
Fri 28 February 2025 |
61.91 (-7.5%) |
68.00 |
60.61 - 79.70 |
0.2416 times |
Fri 31 January 2025 |
66.93 (-3.57%) |
71.70 |
57.50 - 71.70 |
0.1361 times |
Tue 31 December 2024 |
69.41 (5.71%) |
71.98 |
68.38 - 71.98 |
0.004 times |
DMA SMA EMA moving averages of Oswal Agro OSWALAGRO
DMA (daily moving average) of Oswal Agro OSWALAGRO
| DMA period | DMA value | | 5 day DMA | 73.87 | | 12 day DMA | 72.21 | | 20 day DMA | 72.9 | | 35 day DMA | 73.94 | | 50 day DMA | 74.93 | | 100 day DMA | 80.53 | | 150 day DMA | 81.84 | | 200 day DMA | 77.83 | EMA (exponential moving average) of Oswal Agro OSWALAGRO
| EMA period | EMA current | EMA prev | EMA prev2 | | 5 day EMA | 73.59 | 73.33 | 73.43 | | 12 day EMA | 73.04 | 72.85 | 72.8 | | 20 day EMA | 73.14 | 73.04 | 73.03 | | 35 day EMA | 73.86 | 73.84 | 73.88 | | 50 day EMA | 74.78 | 74.81 | 74.88 |
SMA (simple moving average) of Oswal Agro OSWALAGRO
| SMA period | SMA current | SMA prev | SMA prev2 | | 5 day SMA | 73.87 | 73.33 | 72.97 | | 12 day SMA | 72.21 | 72.04 | 71.95 | | 20 day SMA | 72.9 | 72.68 | 72.61 | | 35 day SMA | 73.94 | 74.07 | 74.11 | | 50 day SMA | 74.93 | 74.91 | 74.93 | | 100 day SMA | 80.53 | 80.74 | 80.93 | | 150 day SMA | 81.84 | 81.81 | 81.78 | | 200 day SMA | 77.83 | 77.8 | 77.75 |
|
|
