OrissaMinerals ORISSAMINE full analysis,charts,indicators,moving averages,SMA,DMA,EMA,ADX,MACD,RSIOrissa Minerals ORISSAMINE WideScreen charts, DMA,SMA,EMA technical analysis, forecast prediction, by indicators ADX,MACD,RSI,CCI NSE stock exchange
Daily price and charts and targets OrissaMinerals Strong Daily Stock price targets for OrissaMinerals ORISSAMINE are 5235.25 and 5384.15 | Daily Target 1 | 5200.9 | | Daily Target 2 | 5269.6 | | Daily Target 3 | 5349.8 | | Daily Target 4 | 5418.5 | | Daily Target 5 | 5498.7 |
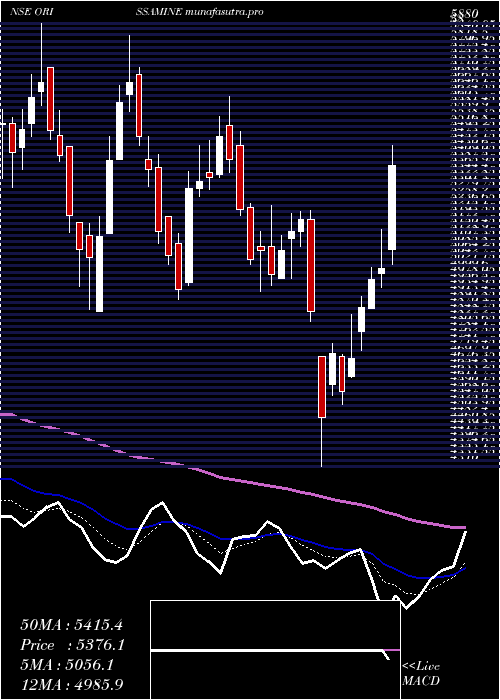
Daily price and volume Orissa Minerals
| Date |
Closing |
Open |
Range |
Volume |
Tue 28 October 2025 |
5338.30 (-1.3%) |
5424.90 |
5281.10 - 5430.00 |
0.611 times |
Mon 27 October 2025 |
5408.40 (0.11%) |
5440.00 |
5325.00 - 5440.00 |
0.6667 times |
Fri 24 October 2025 |
5402.40 (2.31%) |
5280.20 |
5256.80 - 5455.00 |
1.766 times |
Thu 23 October 2025 |
5280.20 (-1.95%) |
5468.30 |
5260.10 - 5468.30 |
0.7833 times |
Tue 21 October 2025 |
5385.20 (0.92%) |
5350.00 |
5345.50 - 5440.00 |
0.2431 times |
Mon 20 October 2025 |
5336.20 (1.29%) |
5321.00 |
5210.50 - 5400.00 |
0.8228 times |
Fri 17 October 2025 |
5268.40 (-0.72%) |
5321.50 |
5227.00 - 5331.00 |
0.5733 times |
Thu 16 October 2025 |
5306.40 (-1.19%) |
5418.40 |
5280.00 - 5424.60 |
0.682 times |
Wed 15 October 2025 |
5370.40 (1.25%) |
5335.00 |
5266.00 - 5479.00 |
1.7231 times |
Tue 14 October 2025 |
5303.90 (-2.25%) |
5439.00 |
5272.20 - 5619.20 |
2.1289 times |
Mon 13 October 2025 |
5425.80 (-2.67%) |
5578.00 |
5380.10 - 5589.00 |
1.5993 times |
Weekly price and charts OrissaMinerals Strong weekly Stock price targets for OrissaMinerals ORISSAMINE are 5230.25 and 5389.15 | Weekly Target 1 | 5194.23 | | Weekly Target 2 | 5266.27 | | Weekly Target 3 | 5353.1333333333 | | Weekly Target 4 | 5425.17 | | Weekly Target 5 | 5512.03 |
Weekly price and volumes for Orissa Minerals
| Date |
Closing |
Open |
Range |
Volume |
Tue 28 October 2025 |
5338.30 (-1.19%) |
5440.00 |
5281.10 - 5440.00 |
0.1309 times |
Fri 24 October 2025 |
5402.40 (2.54%) |
5321.00 |
5210.50 - 5468.30 |
0.3705 times |
Fri 17 October 2025 |
5268.40 (-5.49%) |
5578.00 |
5227.00 - 5619.20 |
0.6873 times |
Fri 10 October 2025 |
5574.40 (-1.45%) |
5770.00 |
5553.00 - 6138.90 |
3.0175 times |
Fri 03 October 2025 |
5656.70 (17.43%) |
4820.00 |
4611.00 - 5694.80 |
2.9518 times |
Fri 26 September 2025 |
4817.10 (-1.12%) |
4900.40 |
4800.00 - 5247.00 |
1.0441 times |
Fri 19 September 2025 |
4871.80 (-1.86%) |
5004.50 |
4781.60 - 5045.00 |
0.2916 times |
Fri 12 September 2025 |
4964.20 (2.72%) |
4871.60 |
4852.00 - 5065.40 |
0.6128 times |
Fri 05 September 2025 |
4832.90 (1.68%) |
4773.50 |
4670.30 - 5094.00 |
0.7686 times |
Fri 29 August 2025 |
4753.10 (-3.75%) |
4939.90 |
4735.30 - 4999.90 |
0.1248 times |
Fri 22 August 2025 |
4938.50 (1.66%) |
4871.00 |
4871.00 - 5270.00 |
0.4303 times |

Monthly price and charts OrissaMinerals Strong monthly Stock price targets for OrissaMinerals ORISSAMINE are 4998.35 and 6478.85 | Monthly Target 1 | 3898.03 | | Monthly Target 2 | 4618.17 | | Monthly Target 3 | 5378.5333333333 | | Monthly Target 4 | 6098.67 | | Monthly Target 5 | 6859.03 |
Monthly price and volumes Orissa Minerals
| Date |
Closing |
Open |
Range |
Volume |
Tue 28 October 2025 |
5338.30 (14.35%) |
4700.00 |
4658.40 - 6138.90 |
2.8679 times |
Tue 30 September 2025 |
4668.30 (-1.78%) |
4773.50 |
4611.00 - 5247.00 |
1.2539 times |
Fri 29 August 2025 |
4753.10 (-3.44%) |
4912.20 |
4695.00 - 5270.00 |
0.4796 times |
Thu 31 July 2025 |
4922.20 (-0.45%) |
4936.00 |
4601.50 - 5420.00 |
1.2128 times |
Mon 30 June 2025 |
4944.50 (-2.94%) |
5079.00 |
4753.00 - 5378.50 |
1.1673 times |
Fri 30 May 2025 |
5094.50 (0.51%) |
5071.00 |
4800.50 - 5735.00 |
0.9051 times |
Wed 30 April 2025 |
5068.60 (1.54%) |
4975.00 |
4310.00 - 5940.00 |
0.784 times |
Fri 28 March 2025 |
4991.80 (-1.7%) |
5130.15 |
4860.00 - 5838.00 |
0.648 times |
Fri 28 February 2025 |
5078.35 (-19.1%) |
6203.00 |
4949.85 - 6420.00 |
0.2926 times |
Fri 31 January 2025 |
6277.70 (-11.62%) |
7125.00 |
5544.05 - 7364.00 |
0.3889 times |
Tue 31 December 2024 |
7103.45 (-9.14%) |
7869.95 |
7000.00 - 7927.00 |
0.3007 times |

DMA SMA EMA moving averages of Orissa Minerals ORISSAMINE
DMA (daily moving average) of Orissa Minerals ORISSAMINE
| DMA period | DMA value | | 5 day DMA | 5362.9 | | 12 day DMA | 5366.67 | | 20 day DMA | 5342.84 | | 35 day DMA | 5159.13 | | 50 day DMA | 5072.05 | | 100 day DMA | 4984.55 | | 150 day DMA | 5033.81 | | 200 day DMA | 5244.36 | EMA (exponential moving average) of Orissa Minerals ORISSAMINE
| EMA period | EMA current | EMA prev | EMA prev2 | | 5 day EMA | 5361.05 | 5372.43 | 5354.45 | | 12 day EMA | 5350.89 | 5353.18 | 5343.14 | | 20 day EMA | 5303.3 | 5299.62 | 5288.17 | | 35 day EMA | 5204.11 | 5196.21 | 5183.72 | | 50 day EMA | 5073 | 5062.18 | 5048.05 |
SMA (simple moving average) of Orissa Minerals ORISSAMINE
| SMA period | SMA current | SMA prev | SMA prev2 | | 5 day SMA | 5362.9 | 5362.48 | 5334.48 | | 12 day SMA | 5366.67 | 5390.59 | 5410.48 | | 20 day SMA | 5342.84 | 5316.78 | 5293.45 | | 35 day SMA | 5159.13 | 5144.69 | 5127.56 | | 50 day SMA | 5072.05 | 5060.13 | 5046.04 | | 100 day SMA | 4984.55 | 4980.25 | 4975.54 | | 150 day SMA | 5033.81 | 5033.69 | 5032.94 | | 200 day SMA | 5244.36 | 5253.06 | 5262.33 |
|
|
