OrientTechnologies ORIENTTECH full analysis,charts,indicators,moving averages,SMA,DMA,EMA,ADX,MACD,RSIOrient Technologies ORIENTTECH WideScreen charts, DMA,SMA,EMA technical analysis, forecast prediction, by indicators ADX,MACD,RSI,CCI NSE stock exchange
Daily price and charts and targets OrientTechnologies Strong Daily Stock price targets for OrientTechnologies ORIENTTECH are 461.1 and 484.65 | Daily Target 1 | 442.65 | | Daily Target 2 | 456 | | Daily Target 3 | 466.2 | | Daily Target 4 | 479.55 | | Daily Target 5 | 489.75 |
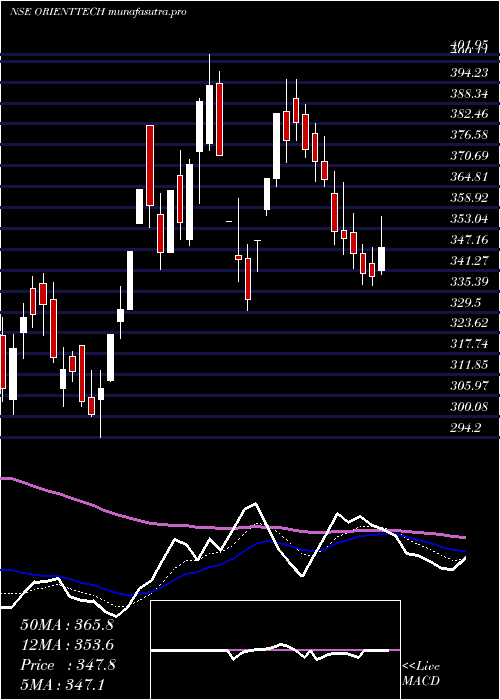
Daily price and volume Orient Technologies
| Date |
Closing |
Open |
Range |
Volume |
Wed 29 October 2025 |
469.35 (3.83%) |
452.85 |
452.85 - 476.40 |
0.9466 times |
Tue 28 October 2025 |
452.05 (-0.63%) |
454.90 |
445.20 - 464.05 |
0.6086 times |
Mon 27 October 2025 |
454.90 (-2.57%) |
468.30 |
450.40 - 469.95 |
0.6348 times |
Fri 24 October 2025 |
466.90 (-3.04%) |
482.80 |
465.55 - 486.80 |
0.6673 times |
Thu 23 October 2025 |
481.55 (2.01%) |
478.95 |
470.20 - 505.50 |
2.3668 times |
Tue 21 October 2025 |
472.05 (1.29%) |
468.45 |
468.15 - 478.00 |
0.2929 times |
Mon 20 October 2025 |
466.05 (2.54%) |
454.90 |
449.45 - 472.00 |
0.8742 times |
Fri 17 October 2025 |
454.50 (-4.06%) |
473.40 |
450.00 - 474.90 |
0.7408 times |
Thu 16 October 2025 |
473.75 (3.18%) |
463.30 |
460.55 - 497.00 |
2.1831 times |
Wed 15 October 2025 |
459.15 (-1.8%) |
465.55 |
456.00 - 469.15 |
0.685 times |
Tue 14 October 2025 |
467.55 (-1.7%) |
478.80 |
452.90 - 478.80 |
1.3536 times |
Weekly price and charts OrientTechnologies Strong weekly Stock price targets for OrientTechnologies ORIENTTECH are 457.28 and 488.48 | Weekly Target 1 | 432.45 | | Weekly Target 2 | 450.9 | | Weekly Target 3 | 463.65 | | Weekly Target 4 | 482.1 | | Weekly Target 5 | 494.85 |
Weekly price and volumes for Orient Technologies
| Date |
Closing |
Open |
Range |
Volume |
Wed 29 October 2025 |
469.35 (0.52%) |
468.30 |
445.20 - 476.40 |
0.3351 times |
Fri 24 October 2025 |
466.90 (2.73%) |
454.90 |
449.45 - 505.50 |
0.6429 times |
Fri 17 October 2025 |
454.50 (0.75%) |
450.00 |
426.10 - 497.00 |
1.2512 times |
Fri 10 October 2025 |
451.10 (6.1%) |
440.00 |
433.65 - 513.40 |
4.6389 times |
Fri 03 October 2025 |
425.15 (22.72%) |
348.10 |
345.15 - 425.15 |
1.3403 times |
Fri 26 September 2025 |
346.45 (-4.22%) |
356.00 |
336.95 - 384.30 |
0.5326 times |
Fri 19 September 2025 |
361.70 (14.05%) |
320.55 |
318.40 - 372.00 |
0.8599 times |
Fri 12 September 2025 |
317.15 (4.6%) |
308.00 |
305.25 - 339.00 |
0.2487 times |
Fri 05 September 2025 |
303.20 (-0.12%) |
304.00 |
300.55 - 314.05 |
0.0786 times |
Fri 29 August 2025 |
303.55 (-2.38%) |
315.00 |
300.00 - 315.00 |
0.0719 times |
Fri 22 August 2025 |
310.95 (0.42%) |
314.00 |
306.50 - 316.15 |
0.1162 times |
Monthly price and charts OrientTechnologies Strong monthly Stock price targets for OrientTechnologies ORIENTTECH are 409.98 and 572.78 | Monthly Target 1 | 281.65 | | Monthly Target 2 | 375.5 | | Monthly Target 3 | 444.45 | | Monthly Target 4 | 538.3 | | Monthly Target 5 | 607.25 |
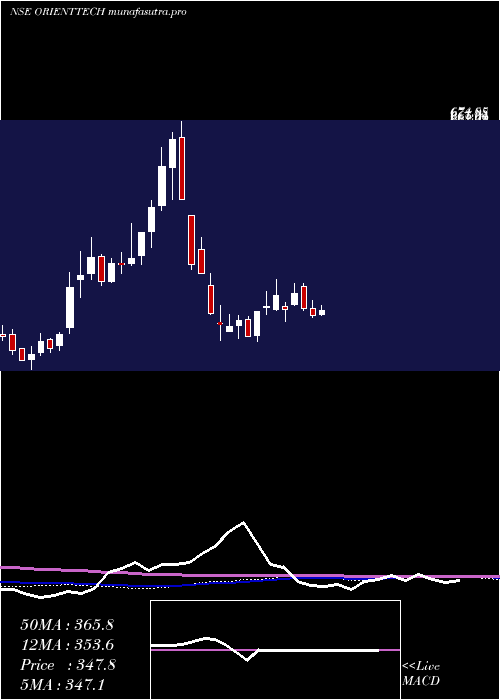
Monthly price and volumes Orient Technologies
| Date |
Closing |
Open |
Range |
Volume |
Wed 29 October 2025 |
469.35 (32.68%) |
353.75 |
350.60 - 513.40 |
4.0862 times |
Tue 30 September 2025 |
353.75 (16.54%) |
304.00 |
300.55 - 384.30 |
0.9265 times |
Fri 29 August 2025 |
303.55 (-4.24%) |
321.00 |
300.00 - 329.50 |
0.2124 times |
Thu 31 July 2025 |
317.00 (-10.19%) |
354.65 |
307.85 - 367.70 |
0.4077 times |
Mon 30 June 2025 |
352.95 (5.3%) |
337.00 |
322.25 - 372.95 |
0.5089 times |
Fri 30 May 2025 |
335.20 (-1.48%) |
343.10 |
312.25 - 384.90 |
0.427 times |
Wed 30 April 2025 |
340.25 (-4.09%) |
350.05 |
330.00 - 401.95 |
0.3473 times |
Fri 28 March 2025 |
354.75 (10.72%) |
323.00 |
294.20 - 382.10 |
0.5246 times |
Fri 28 February 2025 |
320.40 (-25.19%) |
454.00 |
296.85 - 474.35 |
0.6093 times |
Fri 31 January 2025 |
428.30 (-10.95%) |
483.85 |
419.30 - 674.85 |
1.9501 times |
Tue 31 December 2024 |
480.95 (20.71%) |
398.40 |
396.00 - 508.00 |
1.6054 times |

DMA SMA EMA moving averages of Orient Technologies ORIENTTECH
DMA (daily moving average) of Orient Technologies ORIENTTECH
| DMA period | DMA value | | 5 day DMA | 464.95 | | 12 day DMA | 466.12 | | 20 day DMA | 456.05 | | 35 day DMA | 408.4 | | 50 day DMA | 378.15 | | 100 day DMA | 356.27 | | 150 day DMA | 355.06 | | 200 day DMA | 372.54 | EMA (exponential moving average) of Orient Technologies ORIENTTECH
| EMA period | EMA current | EMA prev | EMA prev2 | | 5 day EMA | 463.56 | 460.66 | 464.96 | | 12 day EMA | 459.58 | 457.81 | 458.86 | | 20 day EMA | 445.74 | 443.26 | 442.33 | | 35 day EMA | 416.94 | 413.85 | 411.6 | | 50 day EMA | 381.28 | 377.69 | 374.66 |
SMA (simple moving average) of Orient Technologies ORIENTTECH
| SMA period | SMA current | SMA prev | SMA prev2 | | 5 day SMA | 464.95 | 465.49 | 468.29 | | 12 day SMA | 466.12 | 464.6 | 466.67 | | 20 day SMA | 456.05 | 450.14 | 444.86 | | 35 day SMA | 408.4 | 404.14 | 399.88 | | 50 day SMA | 378.15 | 374.96 | 372.15 | | 100 day SMA | 356.27 | 355.07 | 354.09 | | 150 day SMA | 355.06 | 354.13 | 353.27 | | 200 day SMA | 372.54 | 373.15 | 373.57 |
|
|
