OrientalHotels ORIENTHOT full analysis,charts,indicators,moving averages,SMA,DMA,EMA,ADX,MACD,RSIOriental Hotels ORIENTHOT WideScreen charts, DMA,SMA,EMA technical analysis, forecast prediction, by indicators ADX,MACD,RSI,CCI NSE stock exchange
operates under Hotels sector
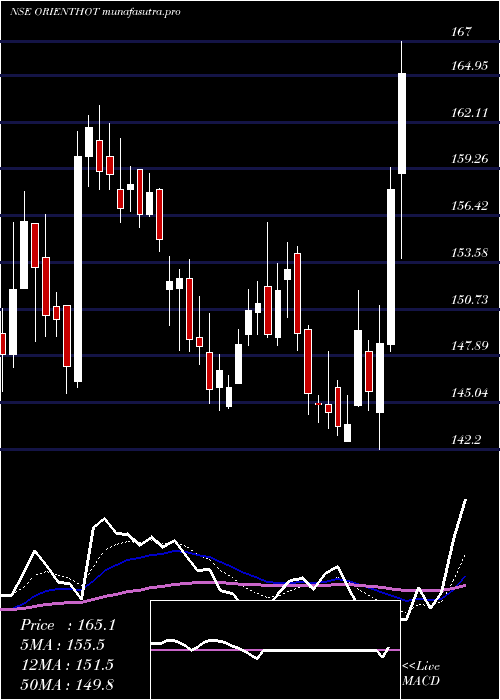
Daily price and charts and targets OrientalHotels Strong Daily Stock price targets for OrientalHotels ORIENTHOT are 122.65 and 124.5 | Daily Target 1 | 122.2 | | Daily Target 2 | 123.1 | | Daily Target 3 | 124.05 | | Daily Target 4 | 124.95 | | Daily Target 5 | 125.9 |
Daily price and volume Oriental Hotels
| Date |
Closing |
Open |
Range |
Volume |
Tue 28 October 2025 |
124.00 (-0.06%) |
124.77 |
123.15 - 125.00 |
0.5296 times |
Mon 27 October 2025 |
124.07 (-0.22%) |
125.30 |
123.10 - 126.30 |
0.575 times |
Fri 24 October 2025 |
124.34 (-0.66%) |
125.17 |
120.35 - 125.79 |
0.9845 times |
Thu 23 October 2025 |
125.17 (0.33%) |
125.50 |
124.67 - 126.95 |
0.5922 times |
Tue 21 October 2025 |
124.76 (-0.36%) |
126.48 |
123.90 - 128.89 |
0.9143 times |
Mon 20 October 2025 |
125.21 (-1.53%) |
127.98 |
123.10 - 128.01 |
1.0697 times |
Fri 17 October 2025 |
127.15 (-0.05%) |
127.50 |
124.99 - 131.90 |
1.5151 times |
Thu 16 October 2025 |
127.21 (0.19%) |
126.97 |
126.21 - 129.20 |
0.4927 times |
Wed 15 October 2025 |
126.97 (1.42%) |
125.25 |
124.00 - 128.00 |
1.7467 times |
Tue 14 October 2025 |
125.19 (-2.05%) |
128.00 |
123.75 - 128.40 |
1.5802 times |
Mon 13 October 2025 |
127.81 (-0.81%) |
128.85 |
126.19 - 129.00 |
0.8382 times |
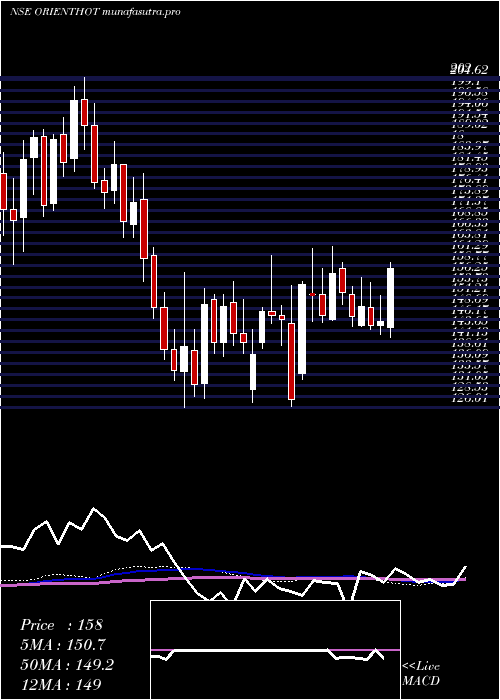
Weekly price and charts OrientalHotels Strong weekly Stock price targets for OrientalHotels ORIENTHOT are 121.95 and 125.15 | Weekly Target 1 | 121.27 | | Weekly Target 2 | 122.63 | | Weekly Target 3 | 124.46666666667 | | Weekly Target 4 | 125.83 | | Weekly Target 5 | 127.67 |
Weekly price and volumes for Oriental Hotels
| Date |
Closing |
Open |
Range |
Volume |
Tue 28 October 2025 |
124.00 (-0.27%) |
125.30 |
123.10 - 126.30 |
0.1861 times |
Fri 24 October 2025 |
124.34 (-2.21%) |
127.98 |
120.35 - 128.89 |
0.6 times |
Fri 17 October 2025 |
127.15 (-1.32%) |
128.85 |
123.75 - 131.90 |
1.0402 times |
Fri 10 October 2025 |
128.85 (-5.81%) |
137.89 |
128.05 - 139.40 |
1.2611 times |
Fri 03 October 2025 |
136.80 (3.53%) |
132.14 |
125.50 - 140.40 |
1.1447 times |
Fri 26 September 2025 |
132.13 (-4.02%) |
137.98 |
131.32 - 138.00 |
0.6311 times |
Fri 19 September 2025 |
137.67 (-3.12%) |
142.51 |
136.25 - 144.95 |
1.4288 times |
Fri 12 September 2025 |
142.10 (1.31%) |
141.01 |
139.67 - 149.50 |
2.1178 times |
Fri 05 September 2025 |
140.26 (2.24%) |
138.00 |
136.55 - 143.00 |
1.1537 times |
Fri 29 August 2025 |
137.19 (-1.79%) |
139.95 |
135.06 - 140.70 |
0.4364 times |
Fri 22 August 2025 |
139.69 (2.08%) |
137.50 |
136.99 - 142.77 |
1.39 times |
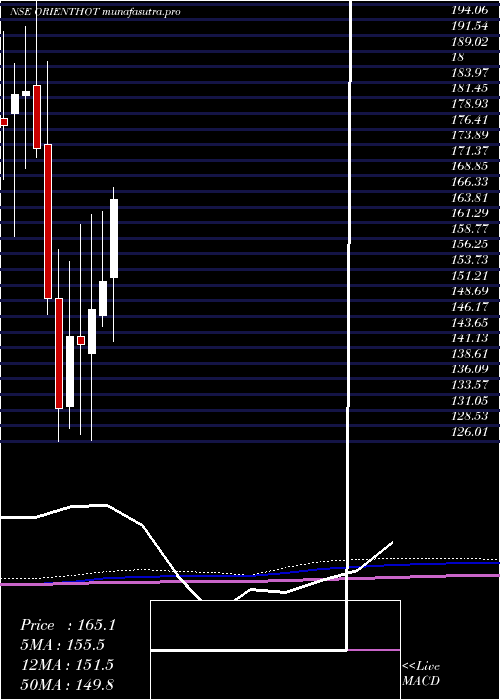
Monthly price and charts OrientalHotels Strong monthly Stock price targets for OrientalHotels ORIENTHOT are 112.15 and 132.2 | Monthly Target 1 | 108.2 | | Monthly Target 2 | 116.1 | | Monthly Target 3 | 128.25 | | Monthly Target 4 | 136.15 | | Monthly Target 5 | 148.3 |
Monthly price and volumes Oriental Hotels
| Date |
Closing |
Open |
Range |
Volume |
Tue 28 October 2025 |
124.00 (-2.87%) |
127.30 |
120.35 - 140.40 |
0.7878 times |
Tue 30 September 2025 |
127.66 (-6.95%) |
138.00 |
127.30 - 149.50 |
1.1208 times |
Fri 29 August 2025 |
137.19 (-4.6%) |
143.81 |
135.06 - 144.77 |
0.5445 times |
Thu 31 July 2025 |
143.81 (-5.29%) |
152.53 |
141.10 - 168.99 |
1.9536 times |
Mon 30 June 2025 |
151.85 (3.12%) |
146.30 |
144.56 - 163.14 |
0.5651 times |
Fri 30 May 2025 |
147.26 (3.94%) |
140.20 |
126.21 - 162.60 |
1.2957 times |
Wed 30 April 2025 |
141.68 (-0.9%) |
143.00 |
127.09 - 161.01 |
0.6918 times |
Fri 28 March 2025 |
142.97 (8.94%) |
131.55 |
128.03 - 155.00 |
0.7655 times |
Fri 28 February 2025 |
131.24 (-11.98%) |
149.00 |
126.01 - 156.99 |
1.1629 times |
Fri 31 January 2025 |
149.10 (-13.93%) |
173.99 |
146.43 - 187.35 |
1.1123 times |
Tue 31 December 2024 |
173.23 (-5.11%) |
183.40 |
171.79 - 202.00 |
1.0942 times |
DMA SMA EMA moving averages of Oriental Hotels ORIENTHOT
DMA (daily moving average) of Oriental Hotels ORIENTHOT
| DMA period | DMA value | | 5 day DMA | 124.47 | | 12 day DMA | 125.89 | | 20 day DMA | 128.24 | | 35 day DMA | 133.19 | | 50 day DMA | 134.77 | | 100 day DMA | 141.65 | | 150 day DMA | 143.21 | | 200 day DMA | 144.95 | EMA (exponential moving average) of Oriental Hotels ORIENTHOT
| EMA period | EMA current | EMA prev | EMA prev2 | | 5 day EMA | 124.59 | 124.88 | 125.29 | | 12 day EMA | 126.28 | 126.69 | 127.17 | | 20 day EMA | 128.24 | 128.69 | 129.18 | | 35 day EMA | 131.05 | 131.47 | 131.91 | | 50 day EMA | 134.08 | 134.49 | 134.91 |
SMA (simple moving average) of Oriental Hotels ORIENTHOT
| SMA period | SMA current | SMA prev | SMA prev2 | | 5 day SMA | 124.47 | 124.71 | 125.33 | | 12 day SMA | 125.89 | 126.44 | 126.95 | | 20 day SMA | 128.24 | 128.64 | 129.17 | | 35 day SMA | 133.19 | 133.66 | 134.11 | | 50 day SMA | 134.77 | 135.07 | 135.37 | | 100 day SMA | 141.65 | 142 | 142.38 | | 150 day SMA | 143.21 | 143.39 | 143.51 | | 200 day SMA | 144.95 | 145.17 | 145.46 |
|
|
