OrientElectric ORIENTELEC full analysis,charts,indicators,moving averages,SMA,DMA,EMA,ADX,MACD,RSIOrient Electric ORIENTELEC WideScreen charts, DMA,SMA,EMA technical analysis, forecast prediction, by indicators ADX,MACD,RSI,CCI NSE stock exchange
operates under REAL_ESTATE_INVESTMENT_TRUST sector
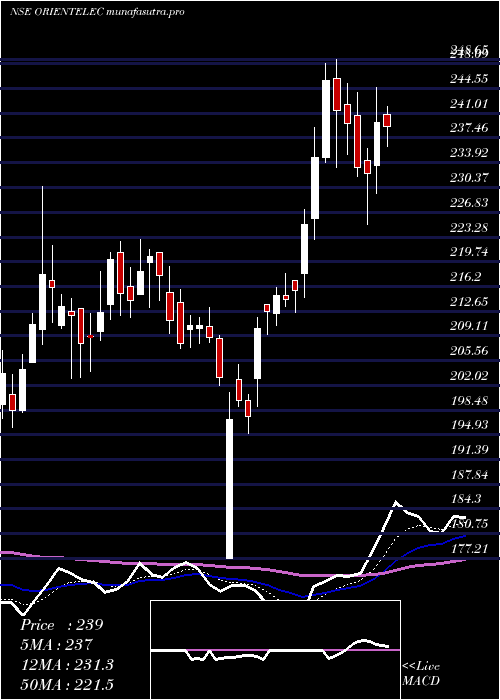
Daily price and charts and targets OrientElectric Strong Daily Stock price targets for OrientElectric ORIENTELEC are 209.44 and 213.84 | Daily Target 1 | 205.99 | | Daily Target 2 | 208.48 | | Daily Target 3 | 210.39 | | Daily Target 4 | 212.88 | | Daily Target 5 | 214.79 |
Daily price and volume Orient Electric
| Date |
Closing |
Open |
Range |
Volume |
Tue 28 October 2025 |
210.97 (1.48%) |
208.99 |
207.90 - 212.30 |
1.3837 times |
Mon 27 October 2025 |
207.90 (-0.77%) |
210.00 |
205.53 - 210.48 |
0.7474 times |
Fri 24 October 2025 |
209.51 (0.75%) |
207.96 |
202.80 - 210.25 |
1.142 times |
Thu 23 October 2025 |
207.96 (0.86%) |
206.70 |
204.32 - 209.09 |
1.7057 times |
Tue 21 October 2025 |
206.19 (0.55%) |
205.00 |
204.94 - 210.00 |
0.4427 times |
Mon 20 October 2025 |
205.06 (-0.47%) |
204.00 |
200.64 - 206.40 |
1.7566 times |
Fri 17 October 2025 |
206.02 (0.47%) |
207.00 |
204.00 - 207.00 |
0.8942 times |
Thu 16 October 2025 |
205.05 (0.69%) |
203.89 |
203.36 - 205.48 |
0.4156 times |
Wed 15 October 2025 |
203.65 (0.78%) |
202.80 |
200.93 - 205.00 |
0.8432 times |
Tue 14 October 2025 |
202.08 (-0.74%) |
203.00 |
200.05 - 203.59 |
0.669 times |
Mon 13 October 2025 |
203.59 (0.58%) |
201.00 |
201.00 - 207.28 |
1.9615 times |
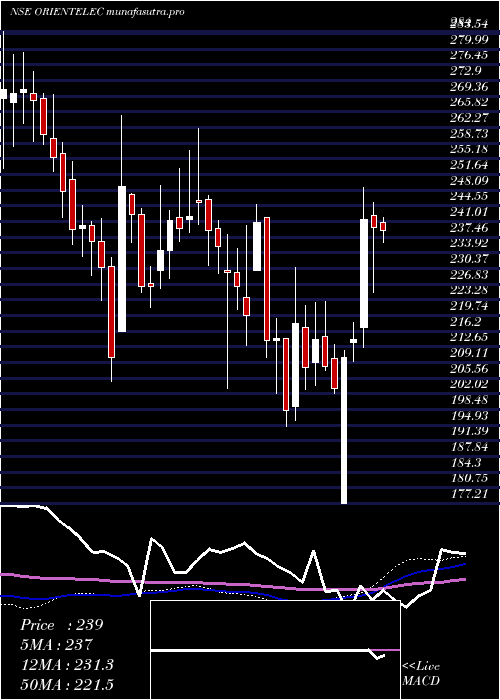
Weekly price and charts OrientElectric Strong weekly Stock price targets for OrientElectric ORIENTELEC are 208.25 and 215.02 | Weekly Target 1 | 202.83 | | Weekly Target 2 | 206.9 | | Weekly Target 3 | 209.6 | | Weekly Target 4 | 213.67 | | Weekly Target 5 | 216.37 |
Weekly price and volumes for Orient Electric
| Date |
Closing |
Open |
Range |
Volume |
Tue 28 October 2025 |
210.97 (0.7%) |
210.00 |
205.53 - 212.30 |
0.2412 times |
Fri 24 October 2025 |
209.51 (1.69%) |
204.00 |
200.64 - 210.25 |
0.5714 times |
Fri 17 October 2025 |
206.02 (1.78%) |
201.00 |
200.05 - 207.28 |
0.5415 times |
Fri 10 October 2025 |
202.42 (1.67%) |
199.47 |
198.05 - 203.30 |
0.364 times |
Fri 03 October 2025 |
199.10 (-0.54%) |
201.98 |
193.47 - 202.10 |
0.417 times |
Fri 26 September 2025 |
200.18 (-1.71%) |
203.05 |
199.60 - 207.53 |
0.6948 times |
Fri 19 September 2025 |
203.66 (0.47%) |
204.00 |
200.96 - 207.00 |
1.4381 times |
Fri 12 September 2025 |
202.70 (-1.32%) |
207.61 |
201.70 - 211.61 |
1.9597 times |
Fri 05 September 2025 |
205.42 (-4.42%) |
213.51 |
204.62 - 219.00 |
1.6117 times |
Fri 29 August 2025 |
214.92 (0.35%) |
215.00 |
206.51 - 217.00 |
2.1606 times |
Fri 22 August 2025 |
214.18 (4.68%) |
205.15 |
205.15 - 215.50 |
0.3787 times |
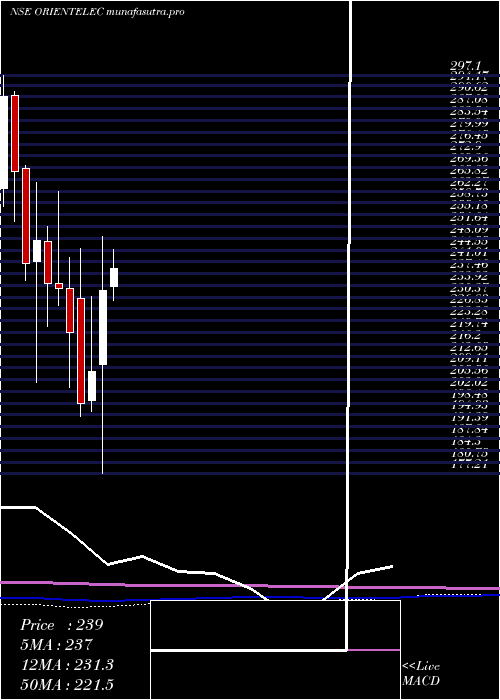
Monthly price and charts OrientElectric Strong monthly Stock price targets for OrientElectric ORIENTELEC are 202.99 and 220.29 | Monthly Target 1 | 188.79 | | Monthly Target 2 | 199.88 | | Monthly Target 3 | 206.09 | | Monthly Target 4 | 217.18 | | Monthly Target 5 | 223.39 |
Monthly price and volumes Orient Electric
| Date |
Closing |
Open |
Range |
Volume |
Tue 28 October 2025 |
210.97 (7.62%) |
195.50 |
195.00 - 212.30 |
0.432 times |
Tue 30 September 2025 |
196.04 (-8.78%) |
213.51 |
193.47 - 219.00 |
1.3359 times |
Fri 29 August 2025 |
214.92 (0%) |
216.00 |
200.86 - 217.81 |
0.7746 times |
Thu 31 July 2025 |
214.92 (-4.08%) |
225.00 |
212.05 - 229.41 |
0.8004 times |
Mon 30 June 2025 |
224.06 (-1.25%) |
227.00 |
213.35 - 232.45 |
0.6596 times |
Fri 30 May 2025 |
226.89 (-2.34%) |
233.49 |
225.01 - 248.90 |
0.9476 times |
Wed 30 April 2025 |
232.32 (11.65%) |
210.00 |
177.21 - 248.65 |
1.4413 times |
Fri 28 March 2025 |
208.07 (4.97%) |
199.24 |
196.00 - 230.59 |
1.2358 times |
Fri 28 February 2025 |
198.21 (-9.76%) |
230.00 |
194.59 - 244.95 |
1.37 times |
Fri 31 January 2025 |
219.65 (-5.7%) |
233.01 |
203.30 - 242.30 |
1.0028 times |
Tue 31 December 2024 |
232.93 (-0.66%) |
234.47 |
228.00 - 262.08 |
1.2302 times |
DMA SMA EMA moving averages of Orient Electric ORIENTELEC
DMA (daily moving average) of Orient Electric ORIENTELEC
| DMA period | DMA value | | 5 day DMA | 208.51 | | 12 day DMA | 205.87 | | 20 day DMA | 202.93 | | 35 day DMA | 203.47 | | 50 day DMA | 205.93 | | 100 day DMA | 212.76 | | 150 day DMA | 217.15 | | 200 day DMA | 218.23 | EMA (exponential moving average) of Orient Electric ORIENTELEC
| EMA period | EMA current | EMA prev | EMA prev2 | | 5 day EMA | 208.61 | 207.43 | 207.19 | | 12 day EMA | 206.37 | 205.53 | 205.1 | | 20 day EMA | 205.24 | 204.64 | 204.3 | | 35 day EMA | 205.38 | 205.05 | 204.88 | | 50 day EMA | 206.24 | 206.05 | 205.97 |
SMA (simple moving average) of Orient Electric ORIENTELEC
| SMA period | SMA current | SMA prev | SMA prev2 | | 5 day SMA | 208.51 | 207.32 | 206.95 | | 12 day SMA | 205.87 | 205.12 | 204.46 | | 20 day SMA | 202.93 | 202.4 | 202.14 | | 35 day SMA | 203.47 | 203.31 | 203.48 | | 50 day SMA | 205.93 | 205.91 | 205.96 | | 100 day SMA | 212.76 | 212.9 | 213.06 | | 150 day SMA | 217.15 | 217.21 | 217.24 | | 200 day SMA | 218.23 | 218.34 | 218.49 |
|
|
