OrientCement ORIENTCEM full analysis,charts,indicators,moving averages,SMA,DMA,EMA,ADX,MACD,RSIOrient Cement ORIENTCEM WideScreen charts, DMA,SMA,EMA technical analysis, forecast prediction, by indicators ADX,MACD,RSI,CCI NSE stock exchange
operates under Cement & Cement Products sector
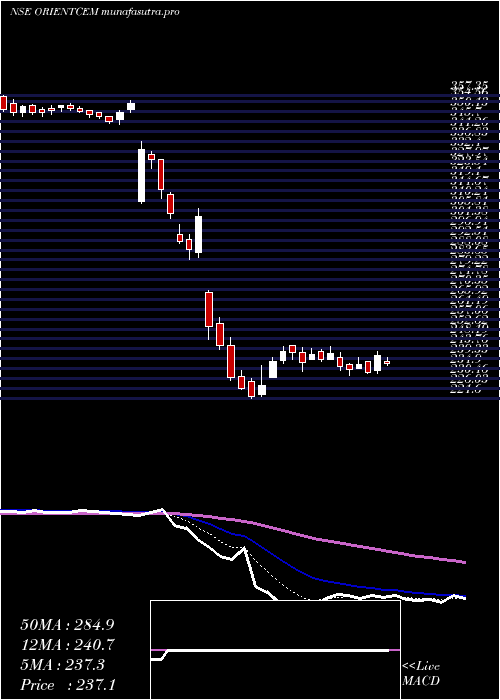
Daily price and charts and targets OrientCement Strong Daily Stock price targets for OrientCement ORIENTCEM are 210.68 and 213.93 | Daily Target 1 | 209.78 | | Daily Target 2 | 211.58 | | Daily Target 3 | 213.03333333333 | | Daily Target 4 | 214.83 | | Daily Target 5 | 216.28 |
Daily price and volume Orient Cement
| Date |
Closing |
Open |
Range |
Volume |
Tue 28 October 2025 |
213.37 (0.21%) |
214.00 |
211.24 - 214.49 |
1.0678 times |
Mon 27 October 2025 |
212.93 (-0.12%) |
214.24 |
212.10 - 218.40 |
1.8128 times |
Fri 24 October 2025 |
213.18 (-0.48%) |
214.90 |
212.40 - 215.20 |
1.0314 times |
Thu 23 October 2025 |
214.20 (-0.69%) |
216.00 |
214.00 - 216.44 |
0.8178 times |
Tue 21 October 2025 |
215.68 (1.04%) |
213.49 |
212.25 - 216.82 |
0.3569 times |
Mon 20 October 2025 |
213.46 (-0.47%) |
214.60 |
212.04 - 215.60 |
0.6551 times |
Fri 17 October 2025 |
214.47 (-0.34%) |
215.48 |
213.55 - 215.59 |
0.74 times |
Thu 16 October 2025 |
215.20 (-0.18%) |
216.00 |
214.67 - 217.10 |
0.8693 times |
Wed 15 October 2025 |
215.58 (0.37%) |
216.00 |
214.40 - 217.79 |
1.1015 times |
Tue 14 October 2025 |
214.79 (-2.08%) |
219.35 |
213.25 - 220.25 |
1.5475 times |
Mon 13 October 2025 |
219.35 (-0.91%) |
222.00 |
218.47 - 222.01 |
0.9633 times |
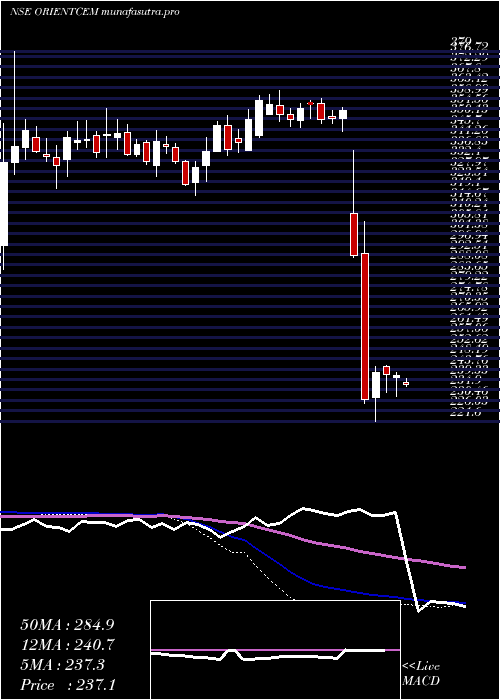
Weekly price and charts OrientCement Strong weekly Stock price targets for OrientCement ORIENTCEM are 208.73 and 215.89 | Weekly Target 1 | 207.18 | | Weekly Target 2 | 210.27 | | Weekly Target 3 | 214.33666666667 | | Weekly Target 4 | 217.43 | | Weekly Target 5 | 221.5 |
Weekly price and volumes for Orient Cement
| Date |
Closing |
Open |
Range |
Volume |
Tue 28 October 2025 |
213.37 (0.09%) |
214.24 |
211.24 - 218.40 |
0.3346 times |
Fri 24 October 2025 |
213.18 (-0.6%) |
214.60 |
212.04 - 216.82 |
0.3323 times |
Fri 17 October 2025 |
214.47 (-3.12%) |
222.00 |
213.25 - 222.01 |
0.6065 times |
Fri 10 October 2025 |
221.37 (-1.49%) |
225.90 |
220.10 - 226.86 |
0.5564 times |
Fri 03 October 2025 |
224.72 (-0.13%) |
225.95 |
217.70 - 226.39 |
0.9119 times |
Fri 26 September 2025 |
225.01 (2.48%) |
220.49 |
220.15 - 237.29 |
2.6699 times |
Fri 19 September 2025 |
219.56 (-0.45%) |
220.90 |
217.05 - 229.66 |
1.6005 times |
Fri 12 September 2025 |
220.55 (-1.54%) |
227.00 |
220.00 - 227.00 |
0.6665 times |
Fri 05 September 2025 |
223.99 (3.12%) |
217.70 |
217.70 - 232.30 |
1.1195 times |
Fri 29 August 2025 |
217.21 (-8.62%) |
238.40 |
214.50 - 239.18 |
1.202 times |
Fri 22 August 2025 |
237.71 (1.66%) |
240.00 |
236.68 - 244.37 |
1.093 times |
Monthly price and charts OrientCement Strong monthly Stock price targets for OrientCement ORIENTCEM are 204.5 and 220.12 | Monthly Target 1 | 201.54 | | Monthly Target 2 | 207.45 | | Monthly Target 3 | 217.15666666667 | | Monthly Target 4 | 223.07 | | Monthly Target 5 | 232.78 |
Monthly price and volumes Orient Cement
| Date |
Closing |
Open |
Range |
Volume |
Tue 28 October 2025 |
213.37 (-2.71%) |
219.00 |
211.24 - 226.86 |
0.2303 times |
Tue 30 September 2025 |
219.32 (0.97%) |
217.70 |
217.05 - 237.29 |
0.7025 times |
Fri 29 August 2025 |
217.21 (-12.16%) |
247.28 |
214.50 - 248.80 |
0.5063 times |
Thu 31 July 2025 |
247.28 (2.16%) |
242.05 |
232.00 - 267.80 |
1.8674 times |
Mon 30 June 2025 |
242.05 (-30.9%) |
350.50 |
221.60 - 355.00 |
2.3941 times |
Fri 30 May 2025 |
350.30 (0.17%) |
352.75 |
346.35 - 358.90 |
0.9555 times |
Wed 30 April 2025 |
349.70 (2.87%) |
336.55 |
336.55 - 362.40 |
0.9151 times |
Fri 28 March 2025 |
339.95 (3.16%) |
330.40 |
323.70 - 351.75 |
1.3915 times |
Fri 28 February 2025 |
329.55 (-3.27%) |
339.10 |
317.60 - 342.80 |
0.5532 times |
Fri 31 January 2025 |
340.70 (-0.67%) |
342.95 |
325.55 - 349.80 |
0.4841 times |
Tue 31 December 2024 |
343.00 (0.19%) |
340.00 |
333.65 - 354.75 |
0.7071 times |
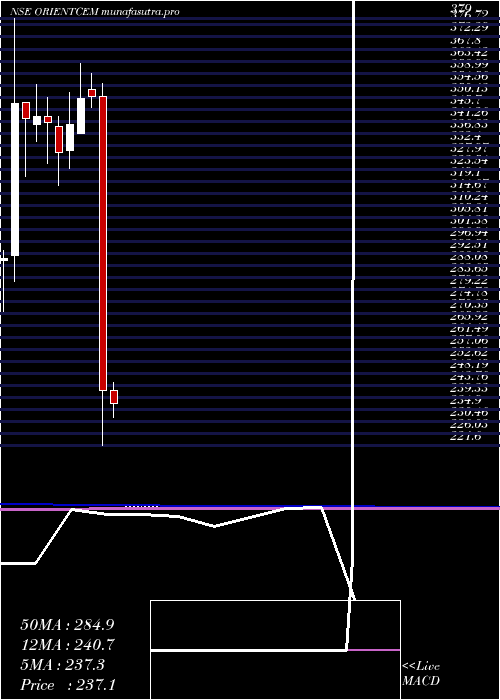
DMA SMA EMA moving averages of Orient Cement ORIENTCEM
DMA (daily moving average) of Orient Cement ORIENTCEM
| DMA period | DMA value | | 5 day DMA | 213.87 | | 12 day DMA | 215.3 | | 20 day DMA | 217.94 | | 35 day DMA | 221.13 | | 50 day DMA | 224.14 | | 100 day DMA | 239.08 | | 150 day DMA | 276.18 | | 200 day DMA | 291.09 | EMA (exponential moving average) of Orient Cement ORIENTCEM
| EMA period | EMA current | EMA prev | EMA prev2 | | 5 day EMA | 213.72 | 213.9 | 214.39 | | 12 day EMA | 215.58 | 215.98 | 216.53 | | 20 day EMA | 217.69 | 218.15 | 218.7 | | 35 day EMA | 220.89 | 221.33 | 221.82 | | 50 day EMA | 224.17 | 224.61 | 225.09 |
SMA (simple moving average) of Orient Cement ORIENTCEM
| SMA period | SMA current | SMA prev | SMA prev2 | | 5 day SMA | 213.87 | 213.89 | 214.2 | | 12 day SMA | 215.3 | 215.98 | 216.66 | | 20 day SMA | 217.94 | 218.52 | 219.56 | | 35 day SMA | 221.13 | 221.44 | 221.83 | | 50 day SMA | 224.14 | 224.57 | 225.07 | | 100 day SMA | 239.08 | 240.41 | 241.76 | | 150 day SMA | 276.18 | 277.07 | 277.96 | | 200 day SMA | 291.09 | 291.74 | 292.39 |
|
|
