OrientBell ORIENTBELL full analysis,charts,indicators,moving averages,SMA,DMA,EMA,ADX,MACD,RSIOrient Bell ORIENTBELL WideScreen charts, DMA,SMA,EMA technical analysis, forecast prediction, by indicators ADX,MACD,RSI,CCI NSE stock exchange
operates under Furniture-Furnishing-Paints sector
Daily price and charts and targets OrientBell Strong Daily Stock price targets for OrientBell ORIENTBELL are 291.78 and 300.08 | Daily Target 1 | 289.93 | | Daily Target 2 | 293.62 | | Daily Target 3 | 298.23333333333 | | Daily Target 4 | 301.92 | | Daily Target 5 | 306.53 |
Daily price and volume Orient Bell
| Date |
Closing |
Open |
Range |
Volume |
Tue 28 October 2025 |
297.30 (-2.62%) |
302.70 |
294.55 - 302.85 |
0.8536 times |
Mon 27 October 2025 |
305.30 (1.09%) |
300.00 |
298.20 - 307.85 |
1.1372 times |
Fri 24 October 2025 |
302.00 (0.85%) |
297.00 |
296.00 - 303.80 |
0.8323 times |
Thu 23 October 2025 |
299.45 (2.39%) |
292.40 |
288.15 - 306.00 |
2.399 times |
Tue 21 October 2025 |
292.45 (3.03%) |
283.85 |
283.85 - 295.00 |
1.155 times |
Mon 20 October 2025 |
283.85 (-1.39%) |
289.75 |
279.40 - 289.75 |
0.9959 times |
Fri 17 October 2025 |
287.85 (-0.42%) |
287.85 |
283.65 - 290.00 |
0.5108 times |
Thu 16 October 2025 |
289.05 (0.54%) |
288.85 |
285.50 - 290.00 |
0.1778 times |
Wed 15 October 2025 |
287.50 (0.68%) |
285.50 |
282.75 - 291.00 |
1.2975 times |
Tue 14 October 2025 |
285.55 (-2.26%) |
290.70 |
283.35 - 292.60 |
0.6409 times |
Mon 13 October 2025 |
292.15 (-3%) |
296.15 |
290.00 - 299.65 |
0.5944 times |
Weekly price and charts OrientBell Strong weekly Stock price targets for OrientBell ORIENTBELL are 289.28 and 302.58 | Weekly Target 1 | 286.6 | | Weekly Target 2 | 291.95 | | Weekly Target 3 | 299.9 | | Weekly Target 4 | 305.25 | | Weekly Target 5 | 313.2 |
Weekly price and volumes for Orient Bell
| Date |
Closing |
Open |
Range |
Volume |
Tue 28 October 2025 |
297.30 (-1.56%) |
300.00 |
294.55 - 307.85 |
0.3607 times |
Fri 24 October 2025 |
302.00 (4.92%) |
289.75 |
279.40 - 306.00 |
0.975 times |
Fri 17 October 2025 |
287.85 (-4.43%) |
296.15 |
282.75 - 299.65 |
0.5836 times |
Fri 10 October 2025 |
301.20 (2.02%) |
299.70 |
273.90 - 312.00 |
2.0026 times |
Fri 03 October 2025 |
295.25 (-0.54%) |
299.15 |
282.25 - 308.50 |
0.8501 times |
Fri 26 September 2025 |
296.85 (-7.7%) |
321.60 |
293.35 - 323.00 |
0.64 times |
Fri 19 September 2025 |
321.60 (4.26%) |
311.50 |
298.00 - 323.90 |
1.3918 times |
Fri 12 September 2025 |
308.45 (4.9%) |
291.25 |
285.00 - 315.90 |
1.4333 times |
Fri 05 September 2025 |
294.05 (-0.54%) |
294.95 |
288.95 - 309.90 |
0.6413 times |
Fri 29 August 2025 |
295.65 (4.64%) |
280.00 |
238.75 - 308.95 |
1.1215 times |
Fri 22 August 2025 |
282.55 (1.35%) |
273.40 |
268.00 - 290.40 |
0.9839 times |

Monthly price and charts OrientBell Strong monthly Stock price targets for OrientBell ORIENTBELL are 285.6 and 323.7 | Monthly Target 1 | 256.3 | | Monthly Target 2 | 276.8 | | Monthly Target 3 | 294.4 | | Monthly Target 4 | 314.9 | | Monthly Target 5 | 332.5 |
Monthly price and volumes Orient Bell
| Date |
Closing |
Open |
Range |
Volume |
Tue 28 October 2025 |
297.30 (3.46%) |
289.35 |
273.90 - 312.00 |
0.5143 times |
Tue 30 September 2025 |
287.35 (-2.81%) |
294.95 |
282.25 - 323.90 |
0.6054 times |
Fri 29 August 2025 |
295.65 (-3.87%) |
307.95 |
238.75 - 316.50 |
0.4279 times |
Thu 31 July 2025 |
307.55 (-2.29%) |
318.50 |
292.20 - 325.90 |
0.5098 times |
Mon 30 June 2025 |
314.75 (28.35%) |
249.69 |
239.01 - 338.20 |
1.703 times |
Fri 30 May 2025 |
245.22 (0.98%) |
240.50 |
224.41 - 278.80 |
2.0271 times |
Wed 30 April 2025 |
242.84 (6.44%) |
228.15 |
223.00 - 269.58 |
0.503 times |
Fri 28 March 2025 |
228.15 (-16.66%) |
276.90 |
216.00 - 277.05 |
2.4201 times |
Fri 28 February 2025 |
273.75 (-0.67%) |
277.05 |
264.05 - 289.00 |
0.5189 times |
Fri 31 January 2025 |
275.60 (-15.38%) |
321.05 |
264.05 - 335.50 |
0.7704 times |
Tue 31 December 2024 |
325.70 (1.61%) |
324.20 |
315.35 - 334.70 |
0.7064 times |
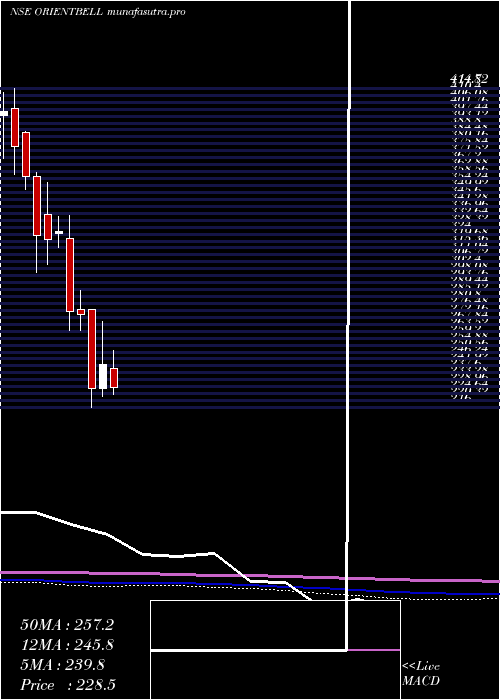
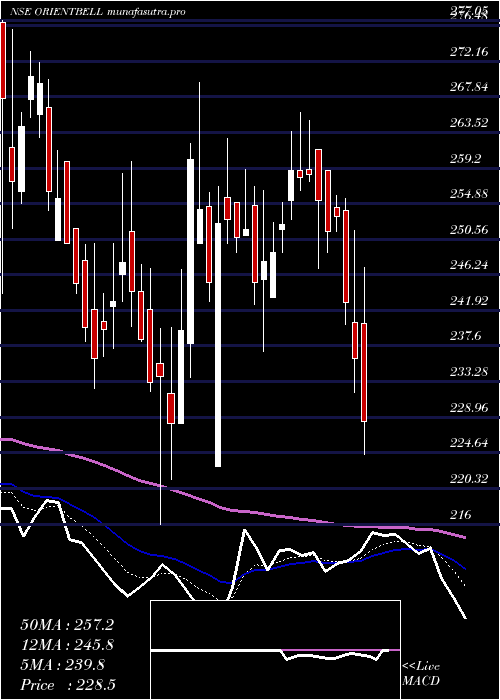
DMA SMA EMA moving averages of Orient Bell ORIENTBELL
DMA (daily moving average) of Orient Bell ORIENTBELL
| DMA period | DMA value | | 5 day DMA | 299.3 | | 12 day DMA | 293.64 | | 20 day DMA | 292.5 | | 35 day DMA | 299.09 | | 50 day DMA | 295.53 | | 100 day DMA | 299.67 | | 150 day DMA | 283.65 | | 200 day DMA | 282.57 | EMA (exponential moving average) of Orient Bell ORIENTBELL
| EMA period | EMA current | EMA prev | EMA prev2 | | 5 day EMA | 298.36 | 298.89 | 295.69 | | 12 day EMA | 295.73 | 295.45 | 293.66 | | 20 day EMA | 295.42 | 295.22 | 294.16 | | 35 day EMA | 294.36 | 294.19 | 293.54 | | 50 day EMA | 295.45 | 295.37 | 294.96 |
SMA (simple moving average) of Orient Bell ORIENTBELL
| SMA period | SMA current | SMA prev | SMA prev2 | | 5 day SMA | 299.3 | 296.61 | 293.12 | | 12 day SMA | 293.64 | 294.34 | 292.3 | | 20 day SMA | 292.5 | 292.48 | 292.51 | | 35 day SMA | 299.09 | 299 | 298.89 | | 50 day SMA | 295.53 | 295.26 | 294.84 | | 100 day SMA | 299.67 | 299.19 | 298.59 | | 150 day SMA | 283.65 | 283.27 | 282.81 | | 200 day SMA | 282.57 | 282.69 | 282.81 |
|
|
