OrianaPower ORIANA_SM full analysis,charts,indicators,moving averages,SMA,DMA,EMA,ADX,MACD,RSIOriana Power ORIANA_SM WideScreen charts, DMA,SMA,EMA technical analysis, forecast prediction, by indicators ADX,MACD,RSI,CCI NSE stock exchange
Daily price and charts and targets OrianaPower Strong Daily Stock price targets for OrianaPower ORIANA_SM are 2829.3 and 2948.3 | Daily Target 1 | 2803.53 | | Daily Target 2 | 2855.07 | | Daily Target 3 | 2922.5333333333 | | Daily Target 4 | 2974.07 | | Daily Target 5 | 3041.53 |
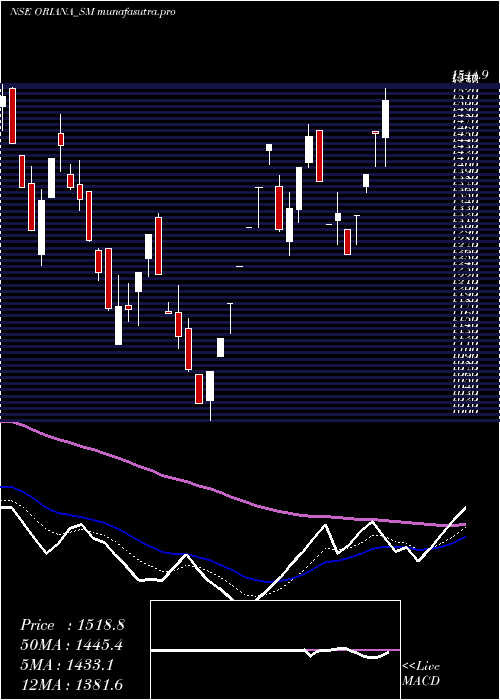
Daily price and volume Oriana Power
| Date |
Closing |
Open |
Range |
Volume |
Tue 28 October 2025 |
2906.60 (-0.59%) |
2922.00 |
2871.00 - 2990.00 |
0.9681 times |
Mon 27 October 2025 |
2923.85 (0.89%) |
2922.50 |
2878.05 - 2978.00 |
0.6865 times |
Fri 24 October 2025 |
2898.10 (0.89%) |
2868.00 |
2850.00 - 2948.00 |
0.7203 times |
Thu 23 October 2025 |
2872.60 (-2.31%) |
2970.00 |
2860.00 - 3039.85 |
0.9297 times |
Tue 21 October 2025 |
2940.40 (1.12%) |
2970.00 |
2911.50 - 3029.00 |
1.0112 times |
Mon 20 October 2025 |
2907.70 (9.33%) |
2866.00 |
2740.10 - 2925.60 |
2.141 times |
Fri 17 October 2025 |
2659.65 (-1.47%) |
2708.00 |
2650.00 - 2780.00 |
0.8081 times |
Thu 16 October 2025 |
2699.20 (-1.47%) |
2738.00 |
2644.00 - 2814.95 |
1.0805 times |
Wed 15 October 2025 |
2739.35 (0.79%) |
2728.70 |
2692.20 - 2800.00 |
0.4787 times |
Tue 14 October 2025 |
2717.85 (-1.15%) |
2768.00 |
2648.05 - 2800.00 |
1.1759 times |
Mon 13 October 2025 |
2749.45 (-1.16%) |
2777.00 |
2670.05 - 2820.00 |
1.0082 times |
Weekly price and charts OrianaPower Strong weekly Stock price targets for OrianaPower ORIANA_SM are 2829.3 and 2948.3 | Weekly Target 1 | 2803.53 | | Weekly Target 2 | 2855.07 | | Weekly Target 3 | 2922.5333333333 | | Weekly Target 4 | 2974.07 | | Weekly Target 5 | 3041.53 |
Weekly price and volumes for Oriana Power
| Date |
Closing |
Open |
Range |
Volume |
Tue 28 October 2025 |
2906.60 (0.29%) |
2922.50 |
2871.00 - 2990.00 |
0.2135 times |
Fri 24 October 2025 |
2898.10 (8.97%) |
2866.00 |
2740.10 - 3039.85 |
0.6196 times |
Fri 17 October 2025 |
2659.65 (-4.39%) |
2777.00 |
2644.00 - 2820.00 |
0.5872 times |
Fri 10 October 2025 |
2781.80 (0.42%) |
2767.95 |
2736.60 - 3054.20 |
0.8951 times |
Fri 03 October 2025 |
2770.30 (15.49%) |
2489.95 |
2476.00 - 2887.90 |
1.0019 times |
Fri 26 September 2025 |
2398.80 (-10.95%) |
2693.65 |
2385.00 - 2730.00 |
0.6003 times |
Fri 19 September 2025 |
2693.65 (4.74%) |
2589.85 |
2435.00 - 2785.00 |
0.8647 times |
Fri 12 September 2025 |
2571.75 (10.22%) |
2329.80 |
2275.00 - 2691.00 |
0.8551 times |
Fri 13 June 2025 |
2333.30 (6.19%) |
2228.00 |
2091.15 - 2363.95 |
2.3271 times |
Fri 06 June 2025 |
2197.25 (23.04%) |
1875.10 |
1875.10 - 2279.10 |
2.0354 times |
Fri 30 May 2025 |
1785.85 (9.49%) |
1630.00 |
1614.70 - 1785.85 |
0.6204 times |

Monthly price and charts OrianaPower Strong monthly Stock price targets for OrianaPower ORIANA_SM are 2775.3 and 3185.5 | Monthly Target 1 | 2458.07 | | Monthly Target 2 | 2682.33 | | Monthly Target 3 | 2868.2666666667 | | Monthly Target 4 | 3092.53 | | Monthly Target 5 | 3278.47 |
Monthly price and volumes Oriana Power
| Date |
Closing |
Open |
Range |
Volume |
Tue 28 October 2025 |
2906.60 (9.91%) |
2720.00 |
2644.00 - 3054.20 |
0.6999 times |
Tue 30 September 2025 |
2644.60 (15.47%) |
2559.95 |
2385.00 - 2785.00 |
0.6493 times |
Mon 16 June 2025 |
2290.35 (28.25%) |
1875.10 |
1875.10 - 2390.00 |
1.1365 times |
Fri 30 May 2025 |
1785.85 (23.55%) |
1445.50 |
1286.20 - 1785.85 |
0.8135 times |
Wed 30 April 2025 |
1445.50 (10.36%) |
1290.00 |
1267.20 - 1739.00 |
0.848 times |
Fri 28 March 2025 |
1309.85 (5.61%) |
1279.90 |
1000.00 - 1447.30 |
1.4159 times |
Fri 28 February 2025 |
1240.25 (-27.37%) |
1629.00 |
1227.65 - 1751.00 |
0.8211 times |
Fri 31 January 2025 |
1707.65 (-24.58%) |
2274.00 |
1475.00 - 2483.05 |
1.4619 times |
Tue 31 December 2024 |
2264.15 (4.24%) |
2158.30 |
2132.50 - 2797.00 |
1.1616 times |
Fri 29 November 2024 |
2172.15 (-4.82%) |
2329.00 |
2130.00 - 2615.20 |
0.9923 times |
Thu 31 October 2024 |
2282.25 (7.37%) |
2136.00 |
1840.00 - 2300.00 |
0.8472 times |

DMA SMA EMA moving averages of Oriana Power ORIANA_SM
DMA (daily moving average) of Oriana Power ORIANA_SM
| DMA period | DMA value | | 5 day DMA | 2908.31 | | 12 day DMA | 2816.38 | | 20 day DMA | 2801.71 | | 35 day DMA | 2693.37 | | 50 day DMA | 2485.22 | | 100 day DMA | 1938.41 | | 150 day DMA | 1890.52 | | 200 day DMA | 1988.78 | EMA (exponential moving average) of Oriana Power ORIANA_SM
| EMA period | EMA current | EMA prev | EMA prev2 | | 5 day EMA | 2890.99 | 2883.19 | 2862.86 | | 12 day EMA | 2839.33 | 2827.1 | 2809.51 | | 20 day EMA | 2775.14 | 2761.31 | 2744.21 | | 35 day EMA | 2616 | 2598.89 | 2579.76 | | 50 day EMA | 2455.37 | 2436.96 | 2417.1 |
SMA (simple moving average) of Oriana Power ORIANA_SM
| SMA period | SMA current | SMA prev | SMA prev2 | | 5 day SMA | 2908.31 | 2908.53 | 2855.69 | | 12 day SMA | 2816.38 | 2807.08 | 2806.7 | | 20 day SMA | 2801.71 | 2776.32 | 2754.82 | | 35 day SMA | 2693.37 | 2676.99 | 2659.2 | | 50 day SMA | 2485.22 | 2459.71 | 2434.3 | | 100 day SMA | 1938.41 | 1921.2 | 1903.78 | | 150 day SMA | 1890.52 | 1887.99 | 1886.11 | | 200 day SMA | 1988.78 | 1984.6 | 1980.42 |
|
|
