OnyxBiotec ONYX_SM full analysis,charts,indicators,moving averages,SMA,DMA,EMA,ADX,MACD,RSIOnyx Biotec ONYX_SM WideScreen charts, DMA,SMA,EMA technical analysis, forecast prediction, by indicators ADX,MACD,RSI,CCI NSE stock exchange
Daily price and charts and targets OnyxBiotec Strong Daily Stock price targets for OnyxBiotec ONYX_SM are 39.5 and 41 | Daily Target 1 | 39.17 | | Daily Target 2 | 39.83 | | Daily Target 3 | 40.666666666667 | | Daily Target 4 | 41.33 | | Daily Target 5 | 42.17 |
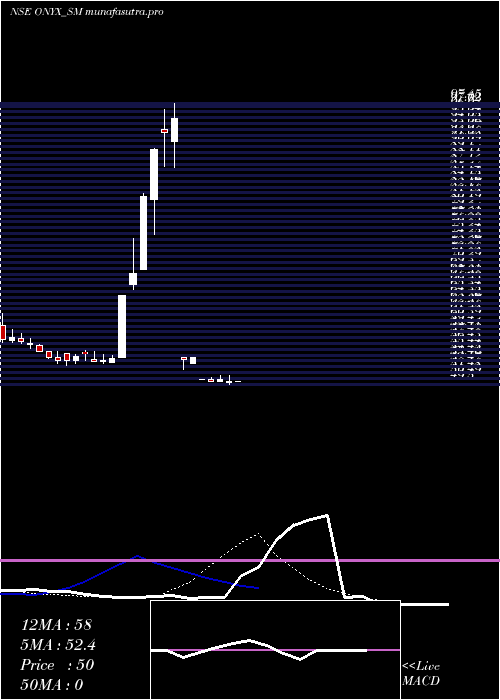
Daily price and volume Onyx Biotec
| Date |
Closing |
Open |
Range |
Volume |
Tue 28 October 2025 |
40.50 (-4.71%) |
41.10 |
40.00 - 41.50 |
4.1525 times |
Mon 27 October 2025 |
42.50 (-3.41%) |
43.00 |
42.50 - 43.00 |
3.4746 times |
Fri 24 October 2025 |
44.00 (-0.68%) |
44.75 |
44.00 - 44.75 |
0.339 times |
Thu 23 October 2025 |
44.30 (3.02%) |
44.35 |
44.30 - 44.35 |
0.1695 times |
Tue 21 October 2025 |
43.00 (18.46%) |
39.40 |
39.40 - 43.00 |
0.339 times |
Mon 20 October 2025 |
36.30 (-14.39%) |
43.00 |
36.30 - 43.00 |
0.1695 times |
Fri 17 October 2025 |
42.40 (0.95%) |
35.50 |
35.50 - 43.00 |
0.5085 times |
Thu 16 October 2025 |
42.00 (0%) |
42.00 |
42.00 - 42.00 |
0.1695 times |
Wed 15 October 2025 |
42.00 (0%) |
42.00 |
42.00 - 42.00 |
0.1695 times |
Tue 14 October 2025 |
42.00 (-3.11%) |
43.10 |
42.00 - 44.00 |
0.5085 times |
Mon 13 October 2025 |
43.35 (4.46%) |
41.40 |
41.40 - 44.50 |
0.339 times |
Weekly price and charts OnyxBiotec Strong weekly Stock price targets for OnyxBiotec ONYX_SM are 38.75 and 41.75 | Weekly Target 1 | 38.17 | | Weekly Target 2 | 39.33 | | Weekly Target 3 | 41.166666666667 | | Weekly Target 4 | 42.33 | | Weekly Target 5 | 44.17 |
Weekly price and volumes for Onyx Biotec
| Date |
Closing |
Open |
Range |
Volume |
Tue 28 October 2025 |
40.50 (-7.95%) |
43.00 |
40.00 - 43.00 |
1.8405 times |
Fri 24 October 2025 |
44.00 (3.77%) |
43.00 |
36.30 - 44.75 |
0.2454 times |
Fri 17 October 2025 |
42.40 (2.17%) |
41.40 |
35.50 - 44.50 |
0.409 times |
Wed 08 October 2025 |
41.50 (-0.36%) |
42.00 |
40.50 - 42.00 |
0.1636 times |
Fri 03 October 2025 |
41.65 (-7.34%) |
42.00 |
41.30 - 43.00 |
0.2658 times |
Fri 26 September 2025 |
44.95 (-0.66%) |
46.00 |
41.30 - 46.45 |
0.2249 times |
Fri 19 September 2025 |
45.25 (-6.12%) |
47.20 |
44.55 - 50.00 |
5.2761 times |
Fri 12 September 2025 |
48.20 (-3.41%) |
49.00 |
48.00 - 50.00 |
1.2679 times |
Thu 04 September 2025 |
49.90 (3.96%) |
47.00 |
47.00 - 51.00 |
0.184 times |
Fri 29 August 2025 |
48.00 (-1.23%) |
48.00 |
47.35 - 48.30 |
0.1227 times |
Thu 21 August 2025 |
48.60 (-2.8%) |
48.55 |
48.55 - 48.60 |
0.1022 times |

Monthly price and charts OnyxBiotec Strong monthly Stock price targets for OnyxBiotec ONYX_SM are 33.38 and 42.63 | Monthly Target 1 | 31 | | Monthly Target 2 | 35.75 | | Monthly Target 3 | 40.25 | | Monthly Target 4 | 45 | | Monthly Target 5 | 49.5 |
Monthly price and volumes Onyx Biotec
| Date |
Closing |
Open |
Range |
Volume |
Tue 28 October 2025 |
40.50 (-5.81%) |
42.00 |
35.50 - 44.75 |
0.2517 times |
Tue 30 September 2025 |
43.00 (-10.42%) |
47.00 |
41.30 - 51.00 |
0.6422 times |
Fri 29 August 2025 |
48.00 (-1.03%) |
48.50 |
46.15 - 53.90 |
0.6977 times |
Mon 28 July 2025 |
48.50 (-5.64%) |
50.05 |
46.00 - 51.00 |
0.4682 times |
Mon 30 June 2025 |
51.40 (9.95%) |
47.50 |
46.30 - 56.00 |
0.4201 times |
Fri 30 May 2025 |
46.75 (-19.12%) |
55.00 |
45.00 - 56.30 |
0.3683 times |
Wed 30 April 2025 |
57.80 (-39.06%) |
54.00 |
48.90 - 58.95 |
0.6181 times |
Thu 02 January 2025 |
94.85 (5.86%) |
93.00 |
86.50 - 97.45 |
0.7033 times |
Tue 31 December 2024 |
89.60 (0%) |
59.50 |
52.60 - 89.80 |
4.8304 times |
Tue 28 October 2025 |
(0%) |
|
- |
0 times |

DMA SMA EMA moving averages of Onyx Biotec ONYX_SM
DMA (daily moving average) of Onyx Biotec ONYX_SM
| DMA period | DMA value | | 5 day DMA | 42.86 | | 12 day DMA | 41.99 | | 20 day DMA | 42.38 | | 35 day DMA | 44.95 | | 50 day DMA | 46.13 | | 100 day DMA | 48.13 | | 150 day DMA | | | 200 day DMA | | EMA (exponential moving average) of Onyx Biotec ONYX_SM
| EMA period | EMA current | EMA prev | EMA prev2 | | 5 day EMA | 41.97 | 42.71 | 42.81 | | 12 day EMA | 42.27 | 42.59 | 42.61 | | 20 day EMA | 42.95 | 43.21 | 43.29 | | 35 day EMA | 44.25 | 44.47 | 44.59 | | 50 day EMA | 46 | 46.22 | 46.37 |
SMA (simple moving average) of Onyx Biotec ONYX_SM
| SMA period | SMA current | SMA prev | SMA prev2 | | 5 day SMA | 42.86 | 42.02 | 42 | | 12 day SMA | 41.99 | 42.11 | 42.07 | | 20 day SMA | 42.38 | 42.62 | 42.78 | | 35 day SMA | 44.95 | 45.18 | 45.33 | | 50 day SMA | 46.13 | 46.29 | 46.4 | | 100 day SMA | 48.13 | 48.24 | 48.34 | | 150 day SMA | | 200 day SMA |
|
|
