OnePoint ONEPOINT_BE full analysis,charts,indicators,moving averages,SMA,DMA,EMA,ADX,MACD,RSIOne Point ONEPOINT_BE WideScreen charts, DMA,SMA,EMA technical analysis, forecast prediction, by indicators ADX,MACD,RSI,CCI NSE stock exchange
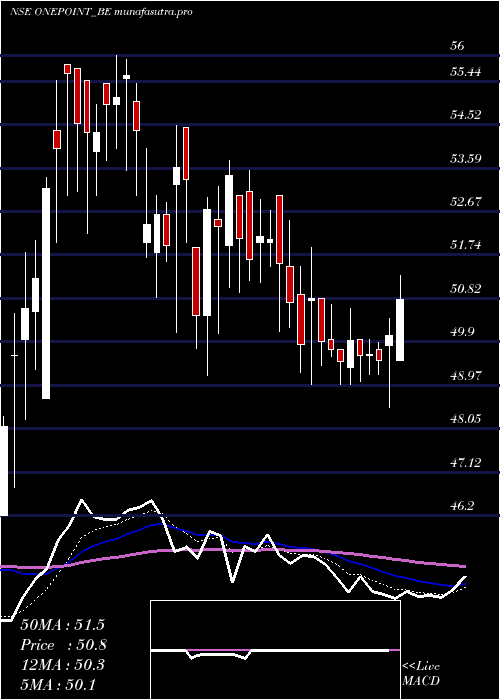
Daily price and charts and targets OnePoint Strong Daily Stock price targets for OnePoint ONEPOINT_BE are 49.27 and 51.17 | Daily Target 1 | 47.75 | | Daily Target 2 | 48.89 | | Daily Target 3 | 49.646666666667 | | Daily Target 4 | 50.79 | | Daily Target 5 | 51.55 |
Daily price and volume One Point
| Date |
Closing |
Open |
Range |
Volume |
Mon 14 July 2025 |
50.04 (1.11%) |
49.83 |
48.50 - 50.40 |
4.015 times |
Fri 11 July 2025 |
49.49 (-0.28%) |
49.74 |
49.20 - 49.89 |
0.2951 times |
Thu 10 July 2025 |
49.63 (0.04%) |
49.60 |
49.20 - 49.95 |
0.2329 times |
Wed 09 July 2025 |
49.61 (-0.62%) |
49.95 |
49.05 - 49.95 |
0.3494 times |
Tue 08 July 2025 |
49.92 (0.89%) |
49.35 |
49.00 - 50.60 |
0.7898 times |
Mon 07 July 2025 |
49.48 (-0.5%) |
49.73 |
49.00 - 49.73 |
0.4033 times |
Fri 04 July 2025 |
49.73 (-0.36%) |
49.95 |
49.58 - 50.69 |
0.3106 times |
Thu 03 July 2025 |
49.91 (-1.77%) |
50.81 |
49.40 - 50.81 |
0.6104 times |
Wed 02 July 2025 |
50.81 (1.95%) |
50.77 |
49.00 - 51.90 |
1.3396 times |
Tue 01 July 2025 |
49.84 (-1.75%) |
50.90 |
49.25 - 51.50 |
1.6539 times |
Mon 30 June 2025 |
50.73 (-1.63%) |
51.50 |
50.21 - 52.49 |
0.8465 times |
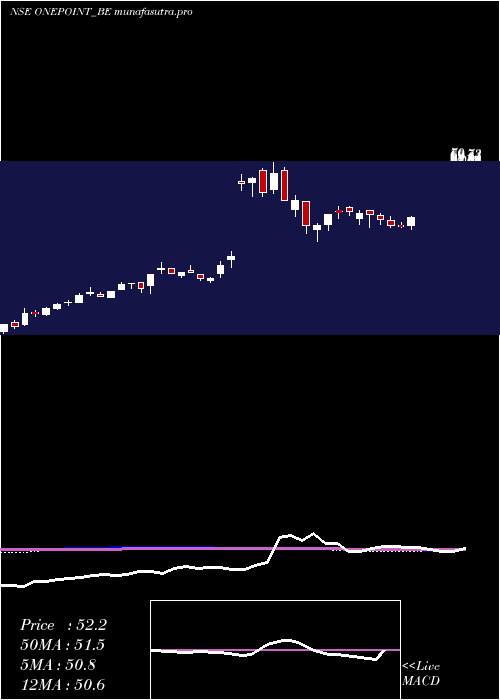
Weekly price and charts OnePoint Strong weekly Stock price targets for OnePoint ONEPOINT_BE are 49.27 and 51.17 | Weekly Target 1 | 47.75 | | Weekly Target 2 | 48.89 | | Weekly Target 3 | 49.646666666667 | | Weekly Target 4 | 50.79 | | Weekly Target 5 | 51.55 |
Weekly price and volumes for One Point
| Date |
Closing |
Open |
Range |
Volume |
Mon 14 July 2025 |
50.04 (1.11%) |
49.83 |
48.50 - 50.40 |
0.7228 times |
Fri 11 July 2025 |
49.49 (-0.48%) |
49.73 |
49.00 - 50.60 |
0.3727 times |
Fri 04 July 2025 |
49.73 (-3.57%) |
51.50 |
49.00 - 52.49 |
0.8571 times |
Fri 27 June 2025 |
51.57 (-3.5%) |
53.00 |
50.11 - 53.55 |
0.7705 times |
Fri 20 June 2025 |
53.44 (-0.3%) |
54.45 |
49.19 - 54.45 |
2.1484 times |
Fri 19 April 2024 |
53.60 (-1.47%) |
52.00 |
50.10 - 54.50 |
0.5364 times |
Fri 12 April 2024 |
54.40 (0.09%) |
55.40 |
53.00 - 56.00 |
0.5302 times |
Fri 05 April 2024 |
54.35 (2.26%) |
54.40 |
52.00 - 55.80 |
0.7208 times |
Thu 28 March 2024 |
53.15 (7.16%) |
49.95 |
48.25 - 53.40 |
2.1864 times |
Fri 22 March 2024 |
49.60 (-0.4%) |
48.35 |
44.65 - 50.50 |
1.1546 times |
Fri 15 March 2024 |
49.80 (-13.84%) |
57.50 |
47.15 - 57.50 |
1.1694 times |
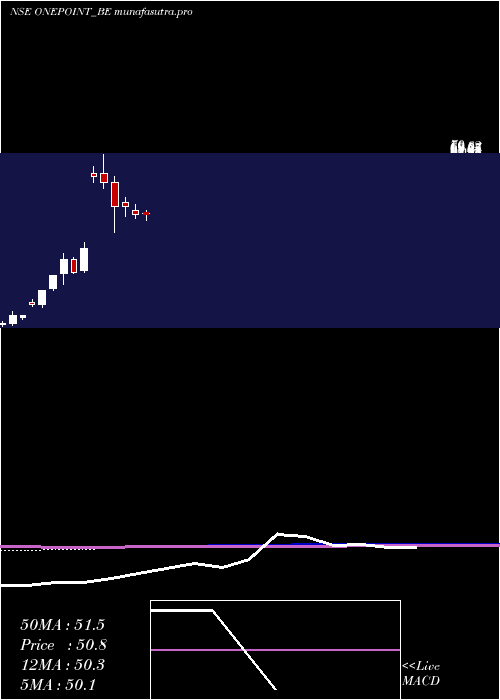
Monthly price and charts OnePoint Strong monthly Stock price targets for OnePoint ONEPOINT_BE are 47.57 and 50.97 | Monthly Target 1 | 46.75 | | Monthly Target 2 | 48.39 | | Monthly Target 3 | 50.146666666667 | | Monthly Target 4 | 51.79 | | Monthly Target 5 | 53.55 |
Monthly price and volumes One Point
| Date |
Closing |
Open |
Range |
Volume |
Mon 14 July 2025 |
50.04 (-1.36%) |
50.90 |
48.50 - 51.90 |
0.6007 times |
Mon 30 June 2025 |
50.73 (-4.91%) |
51.90 |
49.19 - 53.75 |
0.9989 times |
Mon 22 April 2024 |
53.35 (0.38%) |
54.40 |
50.10 - 56.00 |
0.6224 times |
Thu 28 March 2024 |
53.15 (-13.08%) |
61.05 |
44.65 - 62.85 |
2.5028 times |
Thu 29 February 2024 |
61.15 (-2.94%) |
64.00 |
59.00 - 70.00 |
1.3946 times |
Wed 31 January 2024 |
63.00 (59.09%) |
63.90 |
61.00 - 66.10 |
0.0513 times |
Fri 17 November 2023 |
39.60 (24.72%) |
32.35 |
31.70 - 41.45 |
0.8546 times |
Tue 31 October 2023 |
31.75 (-11.81%) |
36.00 |
31.40 - 36.75 |
0.5336 times |
Fri 29 September 2023 |
36.00 (17.26%) |
31.30 |
27.85 - 37.80 |
0.8793 times |
Thu 31 August 2023 |
30.70 (18.3%) |
26.50 |
26.05 - 30.70 |
1.5619 times |
Mon 31 July 2023 |
25.95 (21.26%) |
21.50 |
20.35 - 26.05 |
2.2157 times |
DMA SMA EMA moving averages of One Point ONEPOINT_BE
DMA (daily moving average) of One Point ONEPOINT_BE
| DMA period | DMA value | | 5 day DMA | 49.74 | | 12 day DMA | 50.06 | | 20 day DMA | 50.88 | | 35 day DMA | 52.22 | | 50 day DMA | 51.97 | | 100 day DMA | 50.38 | | 150 day DMA | 43.77 | | 200 day DMA | 37.63 | EMA (exponential moving average) of One Point ONEPOINT_BE
| EMA period | EMA current | EMA prev | EMA prev2 | | 5 day EMA | 49.8 | 49.68 | 49.78 | | 12 day EMA | 50.22 | 50.25 | 50.39 | | 20 day EMA | 50.8 | 50.88 | 51.03 | | 35 day EMA | 51.54 | 51.63 | 51.76 | | 50 day EMA | 52.35 | 52.44 | 52.56 |
SMA (simple moving average) of One Point ONEPOINT_BE
| SMA period | SMA current | SMA prev | SMA prev2 | | 5 day SMA | 49.74 | 49.63 | 49.67 | | 12 day SMA | 50.06 | 50.23 | 50.45 | | 20 day SMA | 50.88 | 51.05 | 51.25 | | 35 day SMA | 52.22 | 52.25 | 52.28 | | 50 day SMA | 51.97 | 52.08 | 52.25 | | 100 day SMA | 50.38 | 50.22 | 50.06 | | 150 day SMA | 43.77 | 43.61 | 43.44 | | 200 day SMA | 37.63 | 37.45 | 37.28 |
|
|
