OlectraGreentech OLECTRA full analysis,charts,indicators,moving averages,SMA,DMA,EMA,ADX,MACD,RSIOlectra Greentech OLECTRA WideScreen charts, DMA,SMA,EMA technical analysis, forecast prediction, by indicators ADX,MACD,RSI,CCI NSE stock exchange
Daily price and charts and targets OlectraGreentech Strong Daily Stock price targets for OlectraGreentech OLECTRA are 1460.8 and 1552.4 | Daily Target 1 | 1388.23 | | Daily Target 2 | 1441.77 | | Daily Target 3 | 1479.8333333333 | | Daily Target 4 | 1533.37 | | Daily Target 5 | 1571.43 |
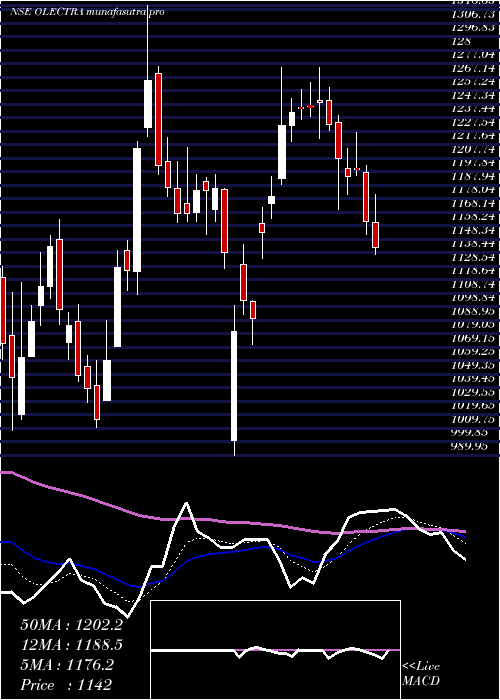
Daily price and volume Olectra Greentech
| Date |
Closing |
Open |
Range |
Volume |
Tue 28 October 2025 |
1495.30 (4.73%) |
1428.40 |
1426.30 - 1517.90 |
2.3591 times |
Mon 27 October 2025 |
1427.80 (1.05%) |
1417.80 |
1416.10 - 1439.00 |
0.7487 times |
Fri 24 October 2025 |
1412.90 (-0.55%) |
1421.70 |
1401.30 - 1431.00 |
0.6186 times |
Thu 23 October 2025 |
1420.70 (-1.31%) |
1443.00 |
1405.00 - 1453.90 |
0.6755 times |
Tue 21 October 2025 |
1439.50 (-0.16%) |
1450.00 |
1430.00 - 1459.90 |
0.2526 times |
Mon 20 October 2025 |
1441.80 (1.04%) |
1430.00 |
1419.60 - 1450.00 |
0.8839 times |
Fri 17 October 2025 |
1426.90 (-1.23%) |
1444.00 |
1422.00 - 1454.80 |
0.9422 times |
Thu 16 October 2025 |
1444.60 (-1.49%) |
1468.50 |
1439.60 - 1473.90 |
0.7088 times |
Wed 15 October 2025 |
1466.40 (1.18%) |
1449.30 |
1449.00 - 1490.00 |
1.1179 times |
Tue 14 October 2025 |
1449.30 (-1.84%) |
1476.40 |
1415.00 - 1489.00 |
1.6927 times |
Mon 13 October 2025 |
1476.40 (-2.7%) |
1509.70 |
1470.00 - 1511.20 |
1.2922 times |
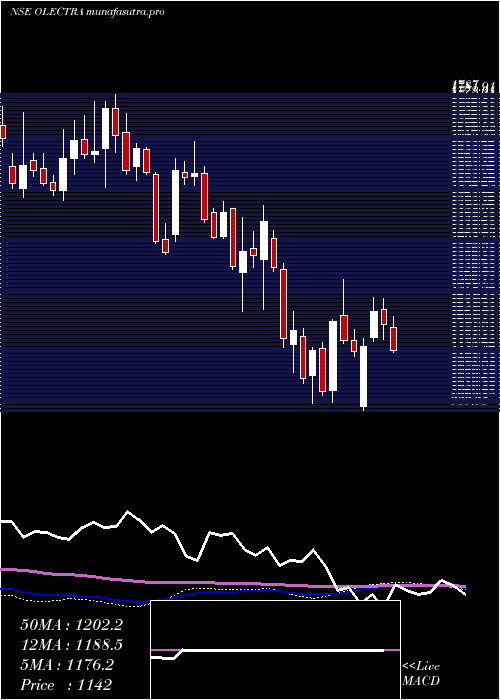
Weekly price and charts OlectraGreentech Strong weekly Stock price targets for OlectraGreentech OLECTRA are 1455.7 and 1557.5 | Weekly Target 1 | 1374.63 | | Weekly Target 2 | 1434.97 | | Weekly Target 3 | 1476.4333333333 | | Weekly Target 4 | 1536.77 | | Weekly Target 5 | 1578.23 |
Weekly price and volumes for Olectra Greentech
| Date |
Closing |
Open |
Range |
Volume |
Tue 28 October 2025 |
1495.30 (5.83%) |
1417.80 |
1416.10 - 1517.90 |
0.3191 times |
Fri 24 October 2025 |
1412.90 (-0.98%) |
1430.00 |
1401.30 - 1459.90 |
0.2496 times |
Fri 17 October 2025 |
1426.90 (-5.96%) |
1509.70 |
1415.00 - 1511.20 |
0.5908 times |
Fri 10 October 2025 |
1517.40 (-1.79%) |
1547.00 |
1511.20 - 1578.00 |
0.4427 times |
Fri 03 October 2025 |
1545.10 (-0.55%) |
1559.00 |
1530.00 - 1595.00 |
0.4609 times |
Fri 26 September 2025 |
1553.60 (-5.27%) |
1639.20 |
1545.80 - 1714.20 |
1.3231 times |
Fri 19 September 2025 |
1640.10 (-0.39%) |
1654.00 |
1622.10 - 1688.40 |
1.0234 times |
Fri 12 September 2025 |
1646.60 (7.99%) |
1529.40 |
1492.70 - 1668.50 |
1.9467 times |
Fri 05 September 2025 |
1524.80 (-1.13%) |
1545.00 |
1520.00 - 1615.00 |
1.0051 times |
Fri 29 August 2025 |
1542.20 (-0.73%) |
1565.00 |
1491.20 - 1690.00 |
2.6385 times |
Fri 22 August 2025 |
1553.50 (5.77%) |
1480.10 |
1444.00 - 1595.70 |
2.2191 times |
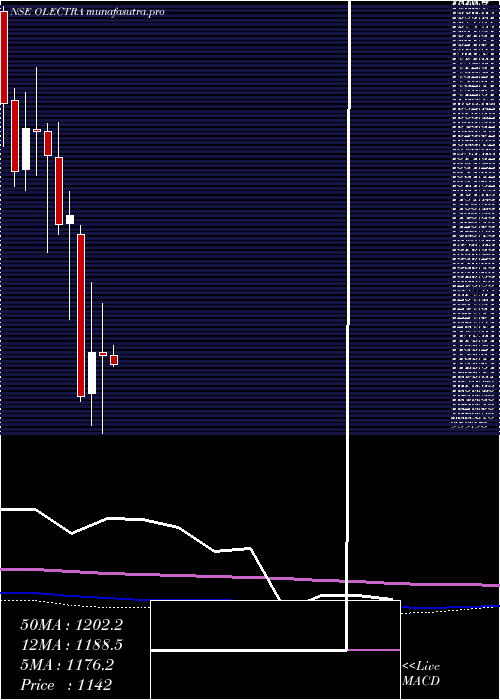
Monthly price and charts OlectraGreentech Strong monthly Stock price targets for OlectraGreentech OLECTRA are 1359.95 and 1536.65 | Monthly Target 1 | 1314.83 | | Monthly Target 2 | 1405.07 | | Monthly Target 3 | 1491.5333333333 | | Monthly Target 4 | 1581.77 | | Monthly Target 5 | 1668.23 |
Monthly price and volumes Olectra Greentech
| Date |
Closing |
Open |
Range |
Volume |
Tue 28 October 2025 |
1495.30 (-3.71%) |
1549.70 |
1401.30 - 1578.00 |
0.3438 times |
Tue 30 September 2025 |
1552.90 (0.69%) |
1545.00 |
1492.70 - 1714.20 |
1.0839 times |
Fri 29 August 2025 |
1542.20 (9.45%) |
1409.10 |
1358.00 - 1690.00 |
1.4468 times |
Thu 31 July 2025 |
1409.00 (20.26%) |
1180.90 |
1177.70 - 1586.20 |
1.9599 times |
Mon 30 June 2025 |
1171.60 (-4.72%) |
1248.00 |
1130.00 - 1261.00 |
0.3849 times |
Fri 30 May 2025 |
1229.60 (5.86%) |
1161.00 |
1080.00 - 1350.00 |
1.091 times |
Wed 30 April 2025 |
1161.50 (-0.51%) |
1168.15 |
989.95 - 1274.50 |
0.6966 times |
Fri 28 March 2025 |
1167.50 (8.94%) |
1078.00 |
1008.30 - 1319.85 |
1.0763 times |
Fri 28 February 2025 |
1071.65 (-26.91%) |
1425.00 |
1060.00 - 1444.55 |
0.5458 times |
Fri 31 January 2025 |
1466.20 (1.36%) |
1447.40 |
1240.00 - 1518.00 |
1.371 times |
Tue 31 December 2024 |
1446.55 (-9.38%) |
1592.00 |
1424.00 - 1668.80 |
0.5187 times |
DMA SMA EMA moving averages of Olectra Greentech OLECTRA
DMA (daily moving average) of Olectra Greentech OLECTRA
| DMA period | DMA value | | 5 day DMA | 1439.24 | | 12 day DMA | 1451.58 | | 20 day DMA | 1490.38 | | 35 day DMA | 1546.79 | | 50 day DMA | 1544.37 | | 100 day DMA | 1412.44 | | 150 day DMA | 1343.28 | | 200 day DMA | 1320.95 | EMA (exponential moving average) of Olectra Greentech OLECTRA
| EMA period | EMA current | EMA prev | EMA prev2 | | 5 day EMA | 1451.27 | 1429.26 | 1429.99 | | 12 day EMA | 1462.68 | 1456.75 | 1462.01 | | 20 day EMA | 1484.86 | 1483.76 | 1489.65 | | 35 day EMA | 1502.53 | 1502.96 | 1507.38 | | 50 day EMA | 1525.28 | 1526.5 | 1530.53 |
SMA (simple moving average) of Olectra Greentech OLECTRA
| SMA period | SMA current | SMA prev | SMA prev2 | | 5 day SMA | 1439.24 | 1428.54 | 1428.36 | | 12 day SMA | 1451.58 | 1454.83 | 1463.13 | | 20 day SMA | 1490.38 | 1493.29 | 1502.49 | | 35 day SMA | 1546.79 | 1547.63 | 1550.78 | | 50 day SMA | 1544.37 | 1544.03 | 1544.12 | | 100 day SMA | 1412.44 | 1409.78 | 1407.89 | | 150 day SMA | 1343.28 | 1340.83 | 1338.37 | | 200 day SMA | 1320.95 | 1320.53 | 1320.84 |
|
|
