NtpcGreen NTPCGREEN full analysis,charts,indicators,moving averages,SMA,DMA,EMA,ADX,MACD,RSINtpc Green NTPCGREEN WideScreen charts, DMA,SMA,EMA technical analysis, forecast prediction, by indicators ADX,MACD,RSI,CCI NSE stock exchange
Daily price and charts and targets NtpcGreen Strong Daily Stock price targets for NtpcGreen NTPCGREEN are 100.83 and 101.8 | Daily Target 1 | 100.57 | | Daily Target 2 | 101.08 | | Daily Target 3 | 101.54 | | Daily Target 4 | 102.05 | | Daily Target 5 | 102.51 |
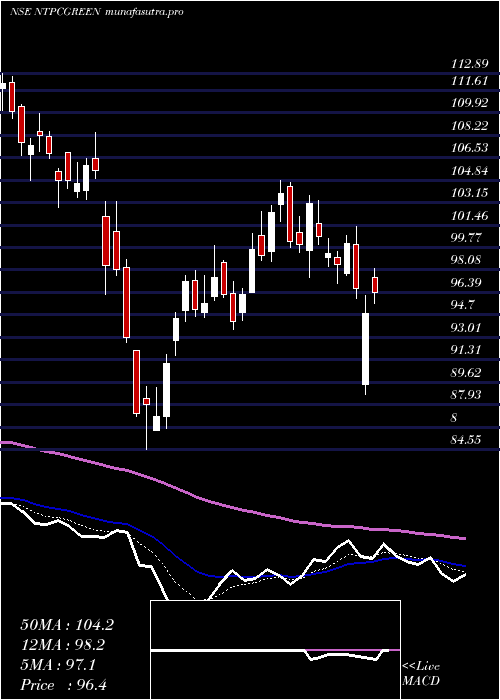
Daily price and volume Ntpc Green
| Date |
Closing |
Open |
Range |
Volume |
Tue 28 October 2025 |
101.59 (0.57%) |
101.70 |
101.03 - 102.00 |
1.0847 times |
Mon 27 October 2025 |
101.01 (-0.46%) |
101.50 |
100.30 - 101.74 |
1.0209 times |
Fri 24 October 2025 |
101.48 (0.69%) |
100.80 |
100.53 - 102.47 |
1.1801 times |
Thu 23 October 2025 |
100.78 (0.23%) |
100.27 |
99.75 - 101.08 |
1.2173 times |
Tue 21 October 2025 |
100.55 (0.57%) |
100.20 |
100.20 - 100.80 |
0.2607 times |
Mon 20 October 2025 |
99.98 (-0.03%) |
100.47 |
99.51 - 100.47 |
0.6366 times |
Fri 17 October 2025 |
100.01 (0.05%) |
99.20 |
99.20 - 100.15 |
0.9905 times |
Thu 16 October 2025 |
99.96 (0.36%) |
99.60 |
99.11 - 100.74 |
1.3093 times |
Wed 15 October 2025 |
99.60 (0.86%) |
98.78 |
98.11 - 99.75 |
0.9271 times |
Tue 14 October 2025 |
98.75 (0.05%) |
98.70 |
97.25 - 99.00 |
1.3728 times |
Mon 13 October 2025 |
98.70 (-0.88%) |
100.07 |
98.45 - 100.71 |
1.5571 times |
Weekly price and charts NtpcGreen Strong weekly Stock price targets for NtpcGreen NTPCGREEN are 100.95 and 102.65 | Weekly Target 1 | 99.6 | | Weekly Target 2 | 100.59 | | Weekly Target 3 | 101.29666666667 | | Weekly Target 4 | 102.29 | | Weekly Target 5 | 103 |
Weekly price and volumes for Ntpc Green
| Date |
Closing |
Open |
Range |
Volume |
Tue 28 October 2025 |
101.59 (0.11%) |
101.50 |
100.30 - 102.00 |
0.2789 times |
Fri 24 October 2025 |
101.48 (1.47%) |
100.47 |
99.51 - 102.47 |
0.4364 times |
Fri 17 October 2025 |
100.01 (0.43%) |
100.07 |
97.25 - 100.74 |
0.8155 times |
Fri 10 October 2025 |
99.58 (2.03%) |
98.00 |
97.34 - 101.00 |
1.1425 times |
Fri 03 October 2025 |
97.60 (-1.79%) |
100.00 |
96.78 - 100.48 |
1.0136 times |
Fri 26 September 2025 |
99.38 (-4.47%) |
104.03 |
99.17 - 104.50 |
1.6424 times |
Fri 19 September 2025 |
104.03 (0.75%) |
103.00 |
103.00 - 108.75 |
2.1171 times |
Fri 12 September 2025 |
103.26 (-0.77%) |
105.00 |
102.08 - 105.95 |
0.8998 times |
Fri 05 September 2025 |
104.06 (1.08%) |
102.90 |
102.32 - 106.36 |
0.8098 times |
Fri 29 August 2025 |
102.95 (-0.35%) |
103.77 |
100.77 - 104.52 |
0.8441 times |
Fri 22 August 2025 |
103.31 (2.49%) |
101.59 |
100.70 - 105.45 |
1.093 times |
Monthly price and charts NtpcGreen Strong monthly Stock price targets for NtpcGreen NTPCGREEN are 99.35 and 104.72 | Monthly Target 1 | 95.02 | | Monthly Target 2 | 98.3 | | Monthly Target 3 | 100.38666666667 | | Monthly Target 4 | 103.67 | | Monthly Target 5 | 105.76 |
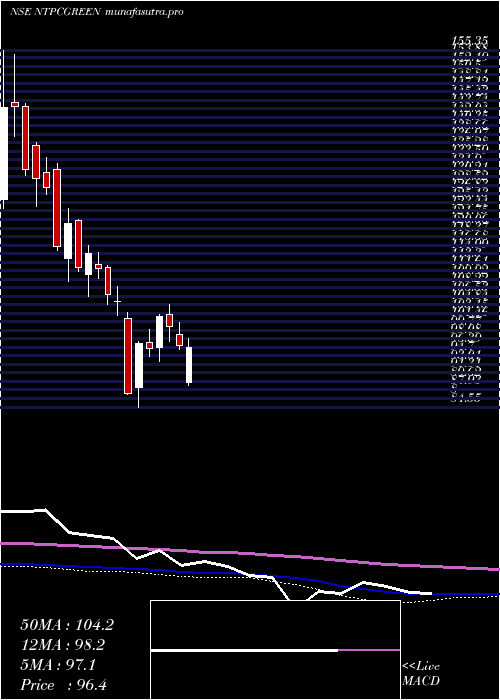
Monthly price and volumes Ntpc Green
| Date |
Closing |
Open |
Range |
Volume |
Tue 28 October 2025 |
101.59 (4.51%) |
97.21 |
97.10 - 102.47 |
0.3641 times |
Tue 30 September 2025 |
97.21 (-5.58%) |
102.90 |
96.78 - 108.75 |
0.7093 times |
Fri 29 August 2025 |
102.95 (-1.27%) |
104.27 |
100.34 - 106.29 |
0.4019 times |
Thu 31 July 2025 |
104.27 (-0.4%) |
105.34 |
103.91 - 114.11 |
1.0146 times |
Mon 30 June 2025 |
104.69 (-5.91%) |
111.50 |
103.10 - 113.56 |
1.4999 times |
Fri 30 May 2025 |
111.26 (10.65%) |
101.00 |
94.50 - 117.64 |
1.6227 times |
Wed 30 April 2025 |
100.55 (-0.06%) |
99.00 |
88.74 - 112.70 |
1.0667 times |
Fri 28 March 2025 |
100.61 (15.29%) |
88.44 |
84.55 - 104.80 |
1.0819 times |
Fri 28 February 2025 |
87.27 (-24.05%) |
112.81 |
87.02 - 115.15 |
0.9786 times |
Fri 31 January 2025 |
114.91 (-9.65%) |
127.70 |
106.48 - 132.95 |
1.2604 times |
Tue 31 December 2024 |
127.19 (1.88%) |
125.80 |
124.00 - 155.35 |
3.0202 times |

DMA SMA EMA moving averages of Ntpc Green NTPCGREEN
DMA (daily moving average) of Ntpc Green NTPCGREEN
| DMA period | DMA value | | 5 day DMA | 101.08 | | 12 day DMA | 100.17 | | 20 day DMA | 99.27 | | 35 day DMA | 100.89 | | 50 day DMA | 101.63 | | 100 day DMA | 104.43 | | 150 day DMA | 104.13 | | 200 day DMA | 104.86 | EMA (exponential moving average) of Ntpc Green NTPCGREEN
| EMA period | EMA current | EMA prev | EMA prev2 | | 5 day EMA | 101.05 | 100.78 | 100.66 | | 12 day EMA | 100.45 | 100.24 | 100.1 | | 20 day EMA | 100.37 | 100.24 | 100.16 | | 35 day EMA | 100.76 | 100.71 | 100.69 | | 50 day EMA | 101.6 | 101.6 | 101.62 |
SMA (simple moving average) of Ntpc Green NTPCGREEN
| SMA period | SMA current | SMA prev | SMA prev2 | | 5 day SMA | 101.08 | 100.76 | 100.56 | | 12 day SMA | 100.17 | 99.88 | 99.68 | | 20 day SMA | 99.27 | 99.16 | 99.2 | | 35 day SMA | 100.89 | 100.96 | 101.03 | | 50 day SMA | 101.63 | 101.61 | 101.64 | | 100 day SMA | 104.43 | 104.49 | 104.55 | | 150 day SMA | 104.13 | 104.11 | 104.08 | | 200 day SMA | 104.86 | 104.97 | 105.11 |
|
|
