NalwaSons NSIL full analysis,charts,indicators,moving averages,SMA,DMA,EMA,ADX,MACD,RSINalwa Sons NSIL WideScreen charts, DMA,SMA,EMA technical analysis, forecast prediction, by indicators ADX,MACD,RSI,CCI NSE stock exchange
operates under Finance (including NBFCs) sector
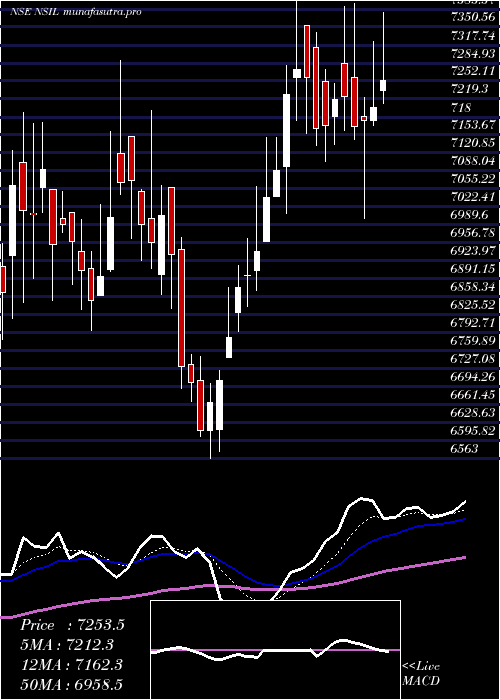
Daily price and charts and targets NalwaSons Strong Daily Stock price targets for NalwaSons NSIL are 8136.75 and 8284.75 | Daily Target 1 | 8031.17 | | Daily Target 2 | 8094.33 | | Daily Target 3 | 8179.1666666667 | | Daily Target 4 | 8242.33 | | Daily Target 5 | 8327.17 |
Daily price and volume Nalwa Sons
| Date |
Closing |
Open |
Range |
Volume |
Tue 28 October 2025 |
8157.50 (0.19%) |
8142.00 |
8116.00 - 8264.00 |
0.284 times |
Mon 27 October 2025 |
8142.00 (0.47%) |
8120.00 |
8093.50 - 8230.00 |
0.2113 times |
Fri 24 October 2025 |
8104.00 (-0.77%) |
8199.00 |
8011.00 - 8202.00 |
0.503 times |
Thu 23 October 2025 |
8166.50 (-2.47%) |
8449.00 |
8140.50 - 8450.50 |
0.7171 times |
Tue 21 October 2025 |
8373.00 (1.36%) |
8301.00 |
8260.50 - 8395.00 |
0.2097 times |
Mon 20 October 2025 |
8260.50 (0.58%) |
8499.00 |
8157.00 - 8501.50 |
1.0039 times |
Fri 17 October 2025 |
8213.00 (4.68%) |
8088.00 |
8074.50 - 8730.00 |
5.7776 times |
Thu 16 October 2025 |
7845.50 (2.57%) |
7750.00 |
7663.50 - 7978.00 |
0.6537 times |
Wed 15 October 2025 |
7649.00 (1.14%) |
7599.00 |
7530.00 - 7740.00 |
0.2534 times |
Tue 14 October 2025 |
7562.50 (-0.95%) |
7727.00 |
7510.00 - 7776.50 |
0.3863 times |
Mon 13 October 2025 |
7635.00 (-0.8%) |
7636.00 |
7600.00 - 7756.00 |
0.2399 times |
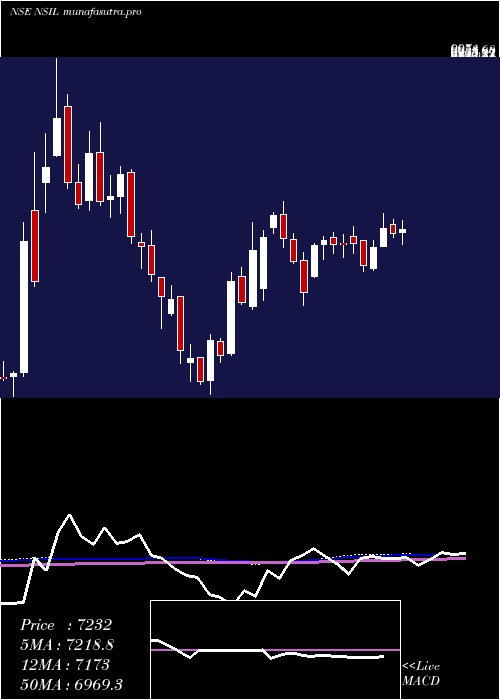
Weekly price and charts NalwaSons Strong weekly Stock price targets for NalwaSons NSIL are 8125.5 and 8296 | Weekly Target 1 | 8001.17 | | Weekly Target 2 | 8079.33 | | Weekly Target 3 | 8171.6666666667 | | Weekly Target 4 | 8249.83 | | Weekly Target 5 | 8342.17 |
Weekly price and volumes for Nalwa Sons
| Date |
Closing |
Open |
Range |
Volume |
Tue 28 October 2025 |
8157.50 (0.66%) |
8120.00 |
8093.50 - 8264.00 |
0.1915 times |
Fri 24 October 2025 |
8104.00 (-1.33%) |
8499.00 |
8011.00 - 8501.50 |
0.9407 times |
Fri 17 October 2025 |
8213.00 (6.71%) |
7636.00 |
7510.00 - 8730.00 |
2.8257 times |
Fri 10 October 2025 |
7696.50 (-2.82%) |
8240.00 |
7630.00 - 8299.00 |
1.0263 times |
Fri 03 October 2025 |
7920.00 (7.95%) |
7373.00 |
7300.50 - 8247.00 |
2.362 times |
Fri 26 September 2025 |
7336.50 (3.03%) |
7106.00 |
7020.50 - 7740.00 |
1.2622 times |
Fri 19 September 2025 |
7121.00 (-0.41%) |
7179.00 |
7035.00 - 7287.00 |
0.289 times |
Fri 12 September 2025 |
7150.50 (1.07%) |
7100.00 |
7062.00 - 7369.00 |
0.5111 times |
Fri 05 September 2025 |
7075.00 (5.73%) |
6720.00 |
6691.50 - 7195.00 |
0.4761 times |
Fri 29 August 2025 |
6691.50 (-0.77%) |
6720.50 |
6609.50 - 6800.00 |
0.1154 times |
Fri 22 August 2025 |
6743.50 (0.65%) |
6779.00 |
6654.50 - 6906.50 |
0.1286 times |
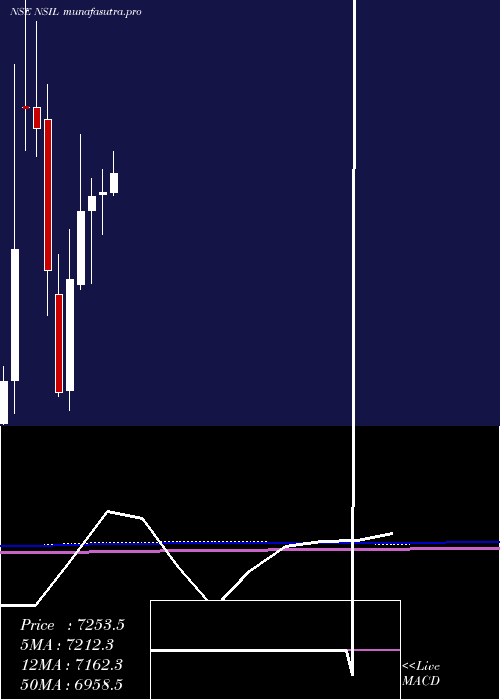
Monthly price and charts NalwaSons Strong monthly Stock price targets for NalwaSons NSIL are 7833.75 and 9053.75 | Monthly Target 1 | 6912.5 | | Monthly Target 2 | 7535 | | Monthly Target 3 | 8132.5 | | Monthly Target 4 | 8755 | | Monthly Target 5 | 9352.5 |
Monthly price and volumes Nalwa Sons
| Date |
Closing |
Open |
Range |
Volume |
Tue 28 October 2025 |
8157.50 (7.33%) |
7785.00 |
7510.00 - 8730.00 |
2.1249 times |
Tue 30 September 2025 |
7600.50 (13.58%) |
6720.00 |
6691.50 - 7740.00 |
0.9801 times |
Fri 29 August 2025 |
6691.50 (-0.91%) |
6740.50 |
6474.00 - 6906.50 |
0.2569 times |
Thu 31 July 2025 |
6753.00 (-4.08%) |
7040.50 |
6670.00 - 7494.00 |
0.5813 times |
Mon 30 June 2025 |
7040.00 (0.71%) |
7012.00 |
6563.00 - 7289.00 |
0.7027 times |
Fri 30 May 2025 |
6990.50 (2.36%) |
6830.00 |
6015.00 - 7194.50 |
0.8958 times |
Wed 30 April 2025 |
6829.00 (12.66%) |
6005.05 |
5955.00 - 7681.00 |
1.4729 times |
Fri 28 March 2025 |
6061.40 (26.37%) |
4821.00 |
4600.00 - 6621.65 |
1.2488 times |
Fri 28 February 2025 |
4796.45 (-22.15%) |
5900.00 |
4753.50 - 6340.00 |
0.6898 times |
Fri 31 January 2025 |
6161.45 (-20.52%) |
7850.00 |
5656.55 - 8250.00 |
1.0466 times |
Tue 31 December 2024 |
7752.50 (-2.96%) |
7989.00 |
7435.15 - 8948.00 |
2.0744 times |
DMA SMA EMA moving averages of Nalwa Sons NSIL
DMA (daily moving average) of Nalwa Sons NSIL
| DMA period | DMA value | | 5 day DMA | 8188.6 | | 12 day DMA | 7983.75 | | 20 day DMA | 7881.33 | | 35 day DMA | 7599.73 | | 50 day DMA | 7364.59 | | 100 day DMA | 7156.7 | | 150 day DMA | 7050.76 | | 200 day DMA | 6766.18 | EMA (exponential moving average) of Nalwa Sons NSIL
| EMA period | EMA current | EMA prev | EMA prev2 | | 5 day EMA | 8141.72 | 8133.83 | 8129.74 | | 12 day EMA | 8023.46 | 7999.1 | 7973.13 | | 20 day EMA | 7878.65 | 7849.31 | 7818.51 | | 35 day EMA | 7637.86 | 7607.27 | 7575.79 | | 50 day EMA | 7391.84 | 7360.6 | 7328.72 |
SMA (simple moving average) of Nalwa Sons NSIL
| SMA period | SMA current | SMA prev | SMA prev2 | | 5 day SMA | 8188.6 | 8209.2 | 8223.4 | | 12 day SMA | 7983.75 | 7951.67 | 7924.54 | | 20 day SMA | 7881.33 | 7840.28 | 7804.3 | | 35 day SMA | 7599.73 | 7568.8 | 7537.93 | | 50 day SMA | 7364.59 | 7336.14 | 7307.71 | | 100 day SMA | 7156.7 | 7143.63 | 7131.26 | | 150 day SMA | 7050.76 | 7038 | 7021.67 | | 200 day SMA | 6766.18 | 6763.37 | 6763.24 |
|
|
