IndoNational NIPPOBATRY full analysis,charts,indicators,moving averages,SMA,DMA,EMA,ADX,MACD,RSIIndo National NIPPOBATRY WideScreen charts, DMA,SMA,EMA technical analysis, forecast prediction, by indicators ADX,MACD,RSI,CCI NSE stock exchange
operates under Non-Durable Household Prod. sector
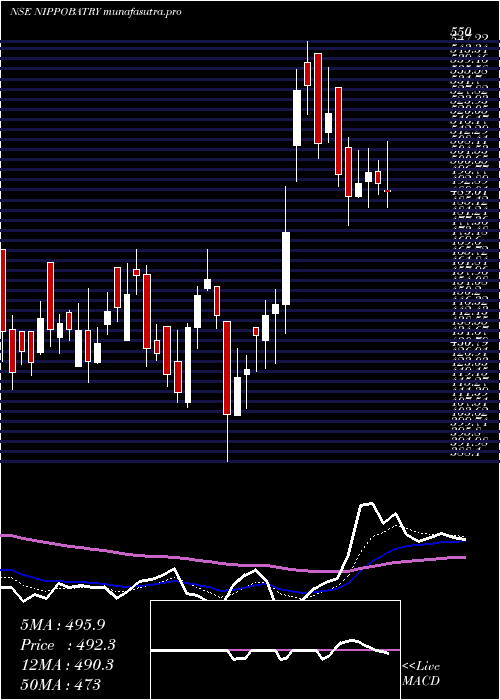
Daily price and charts and targets IndoNational Strong Daily Stock price targets for IndoNational NIPPOBATRY are 440.78 and 453.58 | Daily Target 1 | 438.32 | | Daily Target 2 | 443.23 | | Daily Target 3 | 451.11666666667 | | Daily Target 4 | 456.03 | | Daily Target 5 | 463.92 |
Daily price and volume Indo National
| Date |
Closing |
Open |
Range |
Volume |
Tue 28 October 2025 |
448.15 (-1.09%) |
453.10 |
446.20 - 459.00 |
1.5041 times |
Mon 27 October 2025 |
453.10 (0.3%) |
450.00 |
450.00 - 454.90 |
1.2063 times |
Fri 24 October 2025 |
451.75 (-0.25%) |
452.90 |
450.00 - 454.95 |
0.499 times |
Thu 23 October 2025 |
452.90 (0.72%) |
454.85 |
443.70 - 454.85 |
1.7629 times |
Tue 21 October 2025 |
449.65 (0.81%) |
442.05 |
441.00 - 456.00 |
0.9606 times |
Mon 20 October 2025 |
446.05 (-0.47%) |
452.00 |
441.20 - 452.00 |
1.4905 times |
Fri 17 October 2025 |
448.15 (-0.08%) |
451.45 |
444.15 - 454.80 |
0.5852 times |
Thu 16 October 2025 |
448.50 (0.68%) |
452.95 |
440.00 - 454.00 |
0.5276 times |
Wed 15 October 2025 |
445.45 (0.55%) |
442.25 |
438.25 - 448.00 |
0.7752 times |
Tue 14 October 2025 |
443.00 (-0.17%) |
453.90 |
438.25 - 454.40 |
0.6886 times |
Mon 13 October 2025 |
443.75 (-0.47%) |
440.20 |
438.70 - 448.50 |
0.4915 times |
Weekly price and charts IndoNational Strong weekly Stock price targets for IndoNational NIPPOBATRY are 440.78 and 453.58 | Weekly Target 1 | 438.32 | | Weekly Target 2 | 443.23 | | Weekly Target 3 | 451.11666666667 | | Weekly Target 4 | 456.03 | | Weekly Target 5 | 463.92 |
Weekly price and volumes for Indo National
| Date |
Closing |
Open |
Range |
Volume |
Tue 28 October 2025 |
448.15 (-0.8%) |
450.00 |
446.20 - 459.00 |
0.5461 times |
Fri 24 October 2025 |
451.75 (0.8%) |
452.00 |
441.00 - 456.00 |
0.9496 times |
Fri 17 October 2025 |
448.15 (0.52%) |
440.20 |
438.25 - 454.80 |
0.6182 times |
Fri 10 October 2025 |
445.85 (-2.43%) |
464.00 |
439.00 - 464.00 |
1.1998 times |
Fri 03 October 2025 |
456.95 (1.42%) |
469.70 |
443.90 - 469.70 |
0.5644 times |
Fri 26 September 2025 |
450.55 (-4.36%) |
465.85 |
440.00 - 483.95 |
1.1344 times |
Fri 19 September 2025 |
471.10 (-1.92%) |
485.00 |
467.40 - 490.00 |
1.1509 times |
Fri 12 September 2025 |
480.30 (-2.07%) |
492.95 |
474.95 - 496.60 |
1.3249 times |
Fri 05 September 2025 |
490.45 (6.05%) |
462.50 |
462.50 - 505.90 |
1.5448 times |
Fri 29 August 2025 |
462.45 (-5.17%) |
494.00 |
458.20 - 494.00 |
0.967 times |
Fri 22 August 2025 |
487.65 (4.62%) |
484.60 |
463.60 - 490.15 |
1.842 times |
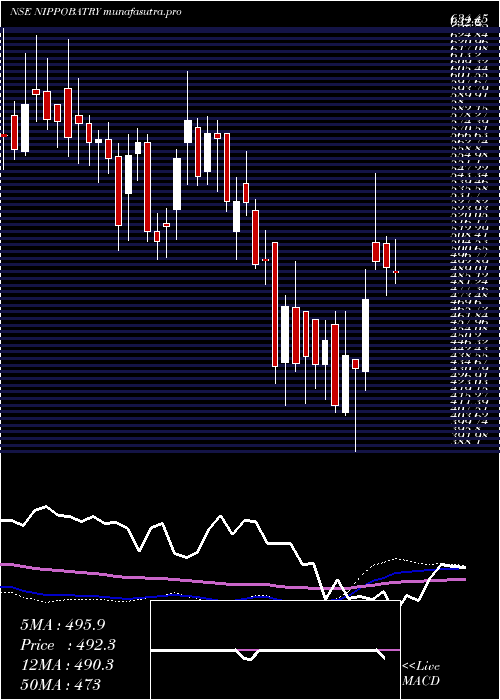
Monthly price and charts IndoNational Strong monthly Stock price targets for IndoNational NIPPOBATRY are 430.33 and 456.08 | Monthly Target 1 | 424.38 | | Monthly Target 2 | 436.27 | | Monthly Target 3 | 450.13333333333 | | Monthly Target 4 | 462.02 | | Monthly Target 5 | 475.88 |
Monthly price and volumes Indo National
| Date |
Closing |
Open |
Range |
Volume |
Tue 28 October 2025 |
448.15 (-0.07%) |
459.90 |
438.25 - 464.00 |
0.3568 times |
Tue 30 September 2025 |
448.45 (-3.03%) |
462.50 |
440.00 - 505.90 |
0.5176 times |
Fri 29 August 2025 |
462.45 (0.89%) |
460.10 |
453.95 - 494.00 |
0.7303 times |
Thu 31 July 2025 |
458.35 (0.12%) |
463.75 |
436.70 - 497.20 |
0.9844 times |
Mon 30 June 2025 |
457.80 (-9.09%) |
515.40 |
446.80 - 515.40 |
1.1895 times |
Fri 30 May 2025 |
503.60 (0.78%) |
499.85 |
479.80 - 534.95 |
0.7606 times |
Wed 30 April 2025 |
499.70 (20.47%) |
411.00 |
388.10 - 550.00 |
2.1227 times |
Fri 28 March 2025 |
414.80 (-5.61%) |
469.75 |
410.80 - 470.00 |
1.0817 times |
Fri 28 February 2025 |
439.45 (-11.58%) |
499.95 |
415.00 - 516.90 |
1.2872 times |
Fri 31 January 2025 |
497.00 (-9.33%) |
551.00 |
494.85 - 575.75 |
0.9692 times |
Tue 31 December 2024 |
548.15 (5.65%) |
528.80 |
511.70 - 609.00 |
1.7404 times |
DMA SMA EMA moving averages of Indo National NIPPOBATRY
DMA (daily moving average) of Indo National NIPPOBATRY
| DMA period | DMA value | | 5 day DMA | 451.11 | | 12 day DMA | 448.03 | | 20 day DMA | 449.18 | | 35 day DMA | 459.52 | | 50 day DMA | 464.99 | | 100 day DMA | 469.07 | | 150 day DMA | 473.82 | | 200 day DMA | 476.15 | EMA (exponential moving average) of Indo National NIPPOBATRY
| EMA period | EMA current | EMA prev | EMA prev2 | | 5 day EMA | 450.18 | 451.19 | 450.24 | | 12 day EMA | 450.21 | 450.59 | 450.13 | | 20 day EMA | 452.3 | 452.74 | 452.7 | | 35 day EMA | 457.45 | 458 | 458.29 | | 50 day EMA | 464.24 | 464.9 | 465.38 |
SMA (simple moving average) of Indo National NIPPOBATRY
| SMA period | SMA current | SMA prev | SMA prev2 | | 5 day SMA | 451.11 | 450.69 | 449.7 | | 12 day SMA | 448.03 | 448.33 | 448.43 | | 20 day SMA | 449.18 | 449.3 | 449.8 | | 35 day SMA | 459.52 | 460.73 | 461.92 | | 50 day SMA | 464.99 | 465.69 | 466.02 | | 100 day SMA | 469.07 | 469.58 | 469.98 | | 150 day SMA | 473.82 | 473.8 | 473.67 | | 200 day SMA | 476.15 | 476.65 | 477.24 |
|
|
