NilaInfrastructur NILAINFRA full analysis,charts,indicators,moving averages,SMA,DMA,EMA,ADX,MACD,RSINila Infrastructur NILAINFRA WideScreen charts, DMA,SMA,EMA technical analysis, forecast prediction, by indicators ADX,MACD,RSI,CCI NSE stock exchange
operates under Realty sector
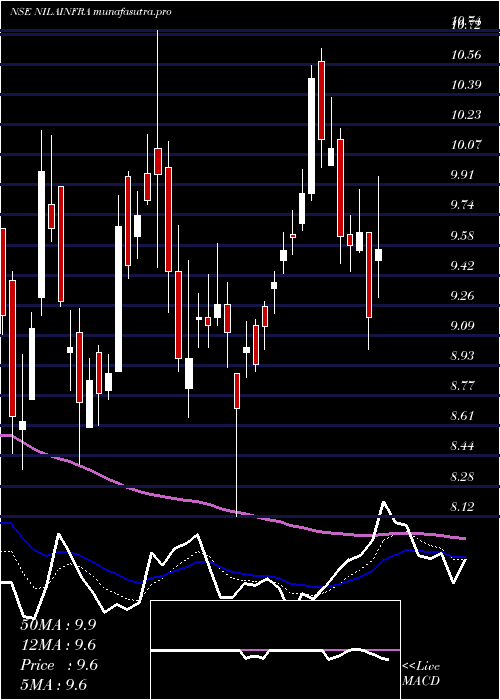
Daily price and charts and targets NilaInfrastructur Strong Daily Stock price targets for NilaInfrastructur NILAINFRA are 10.03 and 10.36 | Daily Target 1 | 9.86 | | Daily Target 2 | 10.02 | | Daily Target 3 | 10.186666666667 | | Daily Target 4 | 10.35 | | Daily Target 5 | 10.52 |
Daily price and volume Nila Infrastructur
| Date |
Closing |
Open |
Range |
Volume |
Wed 29 October 2025 |
10.19 (0%) |
10.19 |
10.02 - 10.35 |
1.1254 times |
Tue 28 October 2025 |
10.19 (-0.59%) |
10.20 |
10.15 - 10.39 |
0.5362 times |
Mon 27 October 2025 |
10.25 (0.1%) |
10.28 |
10.11 - 10.37 |
0.9293 times |
Fri 24 October 2025 |
10.24 (0.39%) |
10.28 |
10.10 - 10.32 |
0.5807 times |
Thu 23 October 2025 |
10.20 (0.49%) |
10.25 |
10.14 - 10.35 |
1.5342 times |
Tue 21 October 2025 |
10.15 (0.79%) |
10.16 |
9.90 - 10.35 |
0.4105 times |
Mon 20 October 2025 |
10.07 (-0.98%) |
10.06 |
9.56 - 10.18 |
1.5546 times |
Fri 17 October 2025 |
10.17 (-0.39%) |
10.20 |
10.05 - 10.28 |
0.8928 times |
Thu 16 October 2025 |
10.21 (0.89%) |
10.15 |
10.04 - 10.34 |
1.1226 times |
Wed 15 October 2025 |
10.12 (-0.39%) |
10.16 |
9.90 - 10.26 |
1.3138 times |
Tue 14 October 2025 |
10.16 (-1.36%) |
10.31 |
10.05 - 10.40 |
0.9174 times |
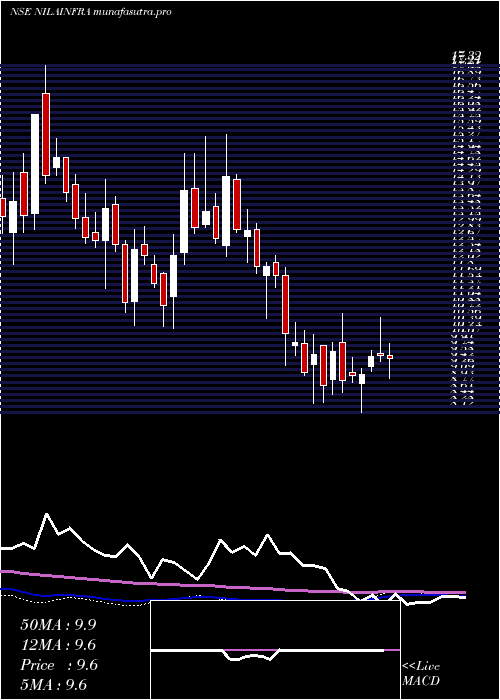
Weekly price and charts NilaInfrastructur Strong weekly Stock price targets for NilaInfrastructur NILAINFRA are 9.92 and 10.29 | Weekly Target 1 | 9.83 | | Weekly Target 2 | 10.01 | | Weekly Target 3 | 10.2 | | Weekly Target 4 | 10.38 | | Weekly Target 5 | 10.57 |
Weekly price and volumes for Nila Infrastructur
| Date |
Closing |
Open |
Range |
Volume |
Wed 29 October 2025 |
10.19 (-0.49%) |
10.28 |
10.02 - 10.39 |
0.4017 times |
Fri 24 October 2025 |
10.24 (0.69%) |
10.06 |
9.56 - 10.35 |
0.6325 times |
Fri 17 October 2025 |
10.17 (-4.24%) |
10.50 |
9.90 - 10.58 |
0.9246 times |
Fri 10 October 2025 |
10.62 (3.21%) |
10.40 |
10.00 - 11.20 |
2.2484 times |
Fri 03 October 2025 |
10.29 (3.42%) |
10.21 |
9.90 - 11.55 |
0.7352 times |
Fri 26 September 2025 |
9.95 (-4.78%) |
10.49 |
9.93 - 10.60 |
1.2324 times |
Fri 19 September 2025 |
10.45 (-2.61%) |
10.87 |
10.40 - 10.90 |
1.1609 times |
Fri 12 September 2025 |
10.73 (3.67%) |
10.51 |
10.35 - 11.00 |
1.1923 times |
Fri 05 September 2025 |
10.35 (-1.99%) |
10.56 |
10.21 - 10.82 |
0.8974 times |
Fri 29 August 2025 |
10.56 (-4.86%) |
10.86 |
10.51 - 11.30 |
0.5746 times |
Fri 22 August 2025 |
11.10 (0.36%) |
11.40 |
11.09 - 11.50 |
0.8423 times |
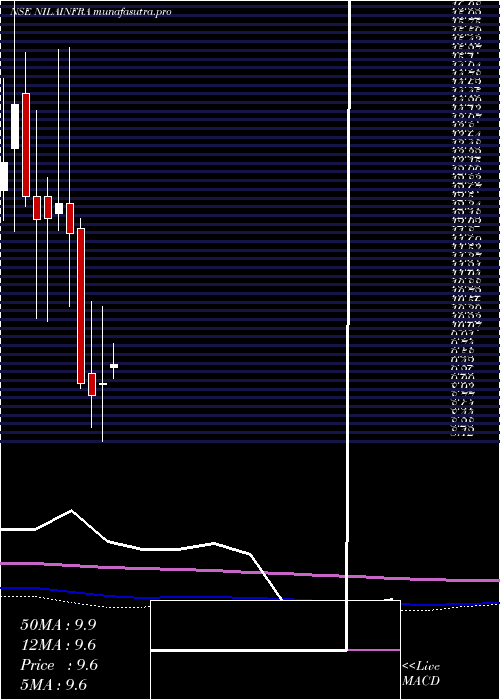
Monthly price and charts NilaInfrastructur Strong monthly Stock price targets for NilaInfrastructur NILAINFRA are 9.88 and 11.52 | Monthly Target 1 | 8.68 | | Monthly Target 2 | 9.43 | | Monthly Target 3 | 10.316666666667 | | Monthly Target 4 | 11.07 | | Monthly Target 5 | 11.96 |
Monthly price and volumes Nila Infrastructur
| Date |
Closing |
Open |
Range |
Volume |
Wed 29 October 2025 |
10.19 (2.1%) |
10.09 |
9.56 - 11.20 |
0.5704 times |
Tue 30 September 2025 |
9.98 (-5.49%) |
10.56 |
9.90 - 11.55 |
0.6222 times |
Fri 29 August 2025 |
10.56 (-9.97%) |
11.72 |
10.51 - 12.00 |
0.3954 times |
Thu 31 July 2025 |
11.73 (-5.71%) |
12.41 |
10.91 - 13.78 |
1.6965 times |
Mon 30 June 2025 |
12.44 (9.22%) |
11.25 |
11.12 - 13.60 |
1.4121 times |
Fri 30 May 2025 |
11.39 (23.94%) |
9.50 |
9.10 - 12.40 |
1.2525 times |
Wed 30 April 2025 |
9.19 (2.45%) |
9.18 |
8.12 - 10.64 |
0.4781 times |
Fri 28 March 2025 |
8.97 (-2.5%) |
9.39 |
8.37 - 10.74 |
0.865 times |
Fri 28 February 2025 |
9.20 (-23.33%) |
12.10 |
9.10 - 12.29 |
0.6049 times |
Fri 31 January 2025 |
12.00 (-4.53%) |
12.57 |
10.63 - 15.49 |
2.1029 times |
Tue 31 December 2024 |
12.57 (2.36%) |
12.37 |
12.06 - 15.45 |
2.0085 times |
DMA SMA EMA moving averages of Nila Infrastructur NILAINFRA
DMA (daily moving average) of Nila Infrastructur NILAINFRA
| DMA period | DMA value | | 5 day DMA | 10.21 | | 12 day DMA | 10.19 | | 20 day DMA | 10.23 | | 35 day DMA | 10.31 | | 50 day DMA | 10.45 | | 100 day DMA | 11.26 | | 150 day DMA | 10.89 | | 200 day DMA | 10.89 | EMA (exponential moving average) of Nila Infrastructur NILAINFRA
| EMA period | EMA current | EMA prev | EMA prev2 | | 5 day EMA | 10.2 | 10.2 | 10.21 | | 12 day EMA | 10.22 | 10.22 | 10.23 | | 20 day EMA | 10.25 | 10.26 | 10.27 | | 35 day EMA | 10.36 | 10.37 | 10.38 | | 50 day EMA | 10.49 | 10.5 | 10.51 |
SMA (simple moving average) of Nila Infrastructur NILAINFRA
| SMA period | SMA current | SMA prev | SMA prev2 | | 5 day SMA | 10.21 | 10.21 | 10.18 | | 12 day SMA | 10.19 | 10.22 | 10.24 | | 20 day SMA | 10.23 | 10.24 | 10.23 | | 35 day SMA | 10.31 | 10.31 | 10.32 | | 50 day SMA | 10.45 | 10.46 | 10.48 | | 100 day SMA | 11.26 | 11.27 | 11.29 | | 150 day SMA | 10.89 | 10.88 | 10.88 | | 200 day SMA | 10.89 | 10.91 | 10.93 |
|
|
