MiraeamcMan50etf NIFTYETF full analysis,charts,indicators,moving averages,SMA,DMA,EMA,ADX,MACD,RSIMiraeamc Man50etf NIFTYETF WideScreen charts, DMA,SMA,EMA technical analysis, forecast prediction, by indicators ADX,MACD,RSI,CCI NSE stock exchange
Daily price and charts and targets MiraeamcMan50etf Strong Daily Stock price targets for MiraeamcMan50etf NIFTYETF are 277.21 and 281.2 | Daily Target 1 | 276.31 | | Daily Target 2 | 278.11 | | Daily Target 3 | 280.30333333333 | | Daily Target 4 | 282.1 | | Daily Target 5 | 284.29 |
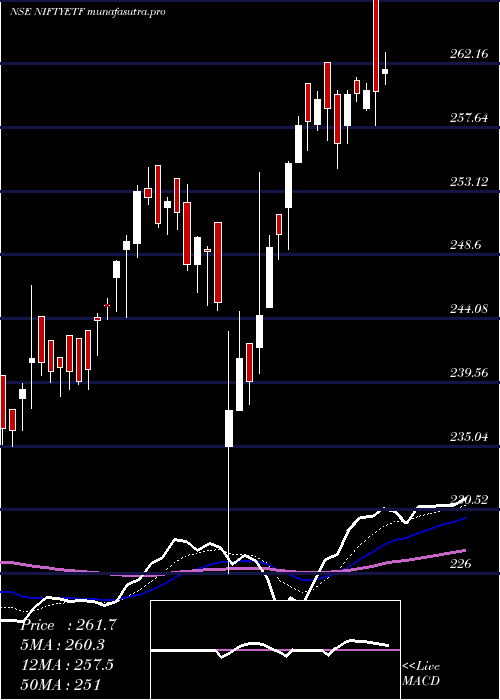
Daily price and volume Miraeamc Man50etf
| Date |
Closing |
Open |
Range |
Volume |
Tue 28 October 2025 |
279.90 (-0.09%) |
282.50 |
278.51 - 282.50 |
0.5772 times |
Mon 27 October 2025 |
280.15 (0.83%) |
279.23 |
277.56 - 280.64 |
0.6351 times |
Fri 24 October 2025 |
277.85 (-0.47%) |
279.73 |
277.30 - 279.74 |
0.3141 times |
Thu 23 October 2025 |
279.16 (0.09%) |
281.50 |
278.82 - 281.50 |
0.5484 times |
Tue 21 October 2025 |
278.92 (0.31%) |
271.10 |
271.10 - 279.99 |
0.1405 times |
Mon 20 October 2025 |
278.06 (0.44%) |
279.47 |
277.66 - 279.47 |
1.679 times |
Fri 17 October 2025 |
276.84 (0.56%) |
275.31 |
275.02 - 277.80 |
0.722 times |
Thu 16 October 2025 |
275.31 (0.82%) |
274.42 |
273.37 - 275.97 |
2.6292 times |
Wed 15 October 2025 |
273.06 (0.77%) |
270.69 |
270.68 - 273.50 |
0.3889 times |
Tue 14 October 2025 |
270.97 (-0.46%) |
272.99 |
270.06 - 272.99 |
2.3654 times |
Mon 13 October 2025 |
272.21 (-0.21%) |
272.50 |
270.93 - 272.52 |
0.4824 times |
Weekly price and charts MiraeamcMan50etf Strong weekly Stock price targets for MiraeamcMan50etf NIFTYETF are 278.73 and 283.67 | Weekly Target 1 | 275.05 | | Weekly Target 2 | 277.47 | | Weekly Target 3 | 279.98666666667 | | Weekly Target 4 | 282.41 | | Weekly Target 5 | 284.93 |
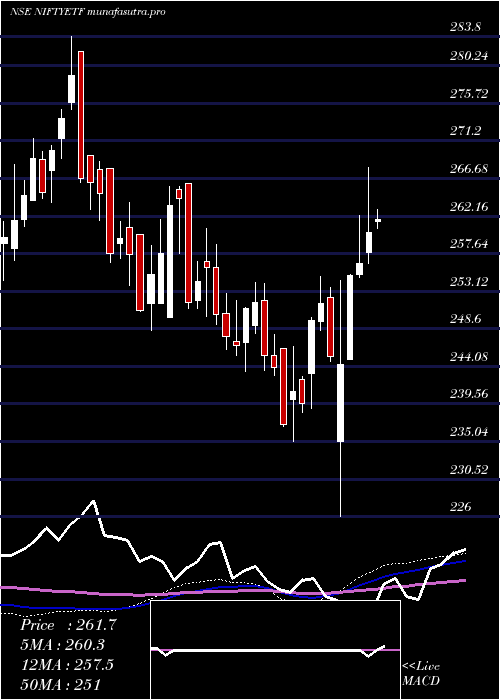
Weekly price and volumes for Miraeamc Man50etf
| Date |
Closing |
Open |
Range |
Volume |
Tue 28 October 2025 |
279.90 (0.74%) |
279.23 |
277.56 - 282.50 |
0.246 times |
Fri 24 October 2025 |
277.85 (0.36%) |
279.47 |
271.10 - 281.50 |
0.5441 times |
Fri 17 October 2025 |
276.84 (1.48%) |
272.50 |
270.06 - 277.80 |
1.3366 times |
Fri 10 October 2025 |
272.79 (1.58%) |
267.43 |
267.43 - 273.14 |
0.759 times |
Fri 03 October 2025 |
268.56 (0.85%) |
267.24 |
265.06 - 274.68 |
0.5644 times |
Fri 26 September 2025 |
266.30 (-2.35%) |
272.70 |
265.46 - 272.98 |
1.3226 times |
Fri 19 September 2025 |
272.71 (0.86%) |
270.37 |
269.77 - 276.00 |
1.2768 times |
Fri 12 September 2025 |
270.38 (1.42%) |
267.00 |
266.59 - 277.66 |
1.7588 times |
Fri 05 September 2025 |
266.59 (1.07%) |
263.76 |
258.16 - 272.34 |
0.9841 times |
Fri 29 August 2025 |
263.77 (-1.7%) |
268.88 |
263.30 - 269.88 |
1.2077 times |
Fri 22 August 2025 |
268.33 (1.04%) |
267.99 |
267.15 - 273.01 |
0.8241 times |
Monthly price and charts MiraeamcMan50etf Strong monthly Stock price targets for MiraeamcMan50etf NIFTYETF are 272.68 and 289.73 | Monthly Target 1 | 258.9 | | Monthly Target 2 | 269.4 | | Monthly Target 3 | 275.95 | | Monthly Target 4 | 286.45 | | Monthly Target 5 | 293 |
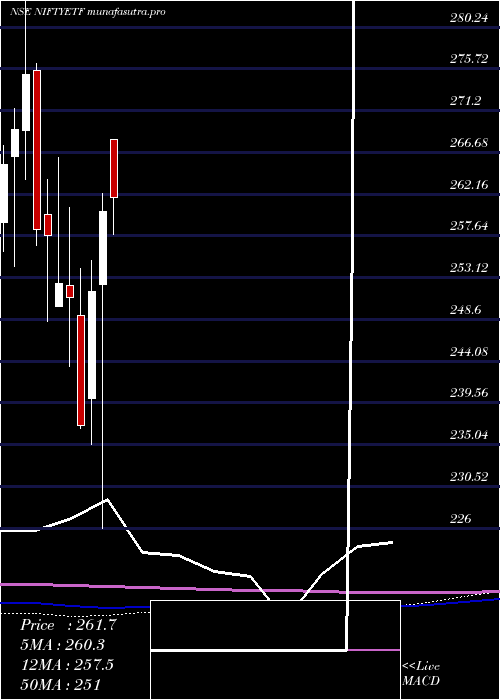
Monthly price and volumes Miraeamc Man50etf
| Date |
Closing |
Open |
Range |
Volume |
Tue 28 October 2025 |
279.90 (5.41%) |
266.85 |
265.45 - 282.50 |
0.5835 times |
Tue 30 September 2025 |
265.53 (0.67%) |
263.76 |
258.16 - 277.66 |
1.0565 times |
Fri 29 August 2025 |
263.77 (-1.12%) |
266.37 |
257.79 - 273.01 |
0.681 times |
Thu 31 July 2025 |
266.75 (-2.77%) |
275.99 |
260.72 - 277.00 |
0.9093 times |
Mon 30 June 2025 |
274.34 (3.41%) |
266.99 |
257.88 - 277.78 |
1.2785 times |
Fri 30 May 2025 |
265.30 (1.94%) |
268.07 |
254.01 - 269.67 |
0.9794 times |
Wed 30 April 2025 |
260.26 (3.45%) |
252.33 |
226.00 - 262.25 |
1.2479 times |
Fri 28 March 2025 |
251.59 (6.12%) |
240.06 |
235.00 - 254.93 |
0.7181 times |
Fri 28 February 2025 |
237.07 (-5.54%) |
249.02 |
236.78 - 254.12 |
0.8986 times |
Fri 31 January 2025 |
250.98 (-0.6%) |
252.25 |
243.50 - 260.70 |
1.647 times |
Tue 31 December 2024 |
252.50 (-2.01%) |
249.95 |
249.95 - 266.08 |
0.4617 times |
DMA SMA EMA moving averages of Miraeamc Man50etf NIFTYETF
DMA (daily moving average) of Miraeamc Man50etf NIFTYETF
| DMA period | DMA value | | 5 day DMA | 279.2 | | 12 day DMA | 276.27 | | 20 day DMA | 273.27 | | 35 day DMA | 271.93 | | 50 day DMA | 270.43 | | 100 day DMA | 269.6 | | 150 day DMA | 265.54 | | 200 day DMA | 260.57 | EMA (exponential moving average) of Miraeamc Man50etf NIFTYETF
| EMA period | EMA current | EMA prev | EMA prev2 | | 5 day EMA | 278.94 | 278.46 | 277.62 | | 12 day EMA | 276.68 | 276.09 | 275.35 | | 20 day EMA | 274.82 | 274.28 | 273.66 | | 35 day EMA | 272.54 | 272.11 | 271.64 | | 50 day EMA | 270.8 | 270.43 | 270.03 |
SMA (simple moving average) of Miraeamc Man50etf NIFTYETF
| SMA period | SMA current | SMA prev | SMA prev2 | | 5 day SMA | 279.2 | 278.83 | 278.17 | | 12 day SMA | 276.27 | 275.55 | 274.7 | | 20 day SMA | 273.27 | 272.59 | 272.01 | | 35 day SMA | 271.93 | 271.55 | 271.16 | | 50 day SMA | 270.43 | 270.14 | 269.82 | | 100 day SMA | 269.6 | 269.43 | 269.26 | | 150 day SMA | 265.54 | 265.3 | 265.06 | | 200 day SMA | 260.57 | 260.43 | 260.31 |
|
|
