UtiamcNifmid150 NIFMID150 full analysis,charts,indicators,moving averages,SMA,DMA,EMA,ADX,MACD,RSIUtiamc Nifmid150 NIFMID150 WideScreen charts, DMA,SMA,EMA technical analysis, forecast prediction, by indicators ADX,MACD,RSI,CCI NSE stock exchange
Daily price and charts and targets UtiamcNifmid150 Strong Daily Stock price targets for UtiamcNifmid150 NIFMID150 are 222.88 and 225.09 | Daily Target 1 | 221.05 | | Daily Target 2 | 222.49 | | Daily Target 3 | 223.26333333333 | | Daily Target 4 | 224.7 | | Daily Target 5 | 225.47 |
Daily price and volume Utiamc Nifmid150
| Date |
Closing |
Open |
Range |
Volume |
Wed 29 October 2025 |
223.92 (0.78%) |
222.47 |
221.83 - 224.04 |
0.911 times |
Tue 28 October 2025 |
222.18 (0.33%) |
221.93 |
221.08 - 222.80 |
0.5102 times |
Mon 27 October 2025 |
221.46 (0.53%) |
221.11 |
221.09 - 222.19 |
0.5591 times |
Fri 24 October 2025 |
220.30 (-0.42%) |
217.20 |
217.19 - 223.26 |
3.3421 times |
Thu 23 October 2025 |
221.24 (0.2%) |
220.80 |
220.50 - 222.19 |
0.4938 times |
Tue 21 October 2025 |
220.80 (0.14%) |
221.15 |
220.71 - 222.25 |
0.3647 times |
Mon 20 October 2025 |
220.50 (0.54%) |
219.40 |
219.40 - 220.94 |
1.6944 times |
Fri 17 October 2025 |
219.31 (-0.42%) |
219.13 |
219.13 - 220.76 |
0.4004 times |
Thu 16 October 2025 |
220.24 (0.51%) |
219.11 |
219.11 - 221.01 |
1.2236 times |
Wed 15 October 2025 |
219.12 (0.39%) |
218.31 |
218.31 - 219.72 |
0.5007 times |
Tue 14 October 2025 |
218.26 (-0.1%) |
217.38 |
216.85 - 218.58 |
0.2699 times |
Weekly price and charts UtiamcNifmid150 Strong weekly Stock price targets for UtiamcNifmid150 NIFMID150 are 222.5 and 225.46 | Weekly Target 1 | 220.05 | | Weekly Target 2 | 221.99 | | Weekly Target 3 | 223.01333333333 | | Weekly Target 4 | 224.95 | | Weekly Target 5 | 225.97 |
Weekly price and volumes for Utiamc Nifmid150
| Date |
Closing |
Open |
Range |
Volume |
Wed 29 October 2025 |
223.92 (1.64%) |
221.11 |
221.08 - 224.04 |
0.2194 times |
Fri 24 October 2025 |
220.30 (0.45%) |
219.40 |
217.19 - 223.26 |
0.6532 times |
Fri 17 October 2025 |
219.31 (0.35%) |
218.55 |
216.85 - 221.01 |
0.5316 times |
Fri 10 October 2025 |
218.54 (1.18%) |
219.84 |
215.17 - 219.84 |
2.8228 times |
Fri 03 October 2025 |
216.00 (2.26%) |
212.30 |
209.00 - 235.48 |
4.341 times |
Fri 26 September 2025 |
211.23 (-4.03%) |
225.00 |
211.00 - 226.70 |
0.3513 times |
Fri 19 September 2025 |
220.11 (1.33%) |
217.24 |
217.06 - 223.90 |
0.2585 times |
Fri 12 September 2025 |
217.23 (1.55%) |
215.79 |
213.28 - 217.87 |
0.1854 times |
Fri 05 September 2025 |
213.92 (1.85%) |
210.04 |
210.01 - 215.71 |
0.2499 times |
Fri 29 August 2025 |
210.04 (-3.19%) |
215.88 |
209.23 - 218.95 |
0.387 times |
Fri 22 August 2025 |
216.96 (1.86%) |
217.25 |
213.55 - 218.70 |
0.3128 times |
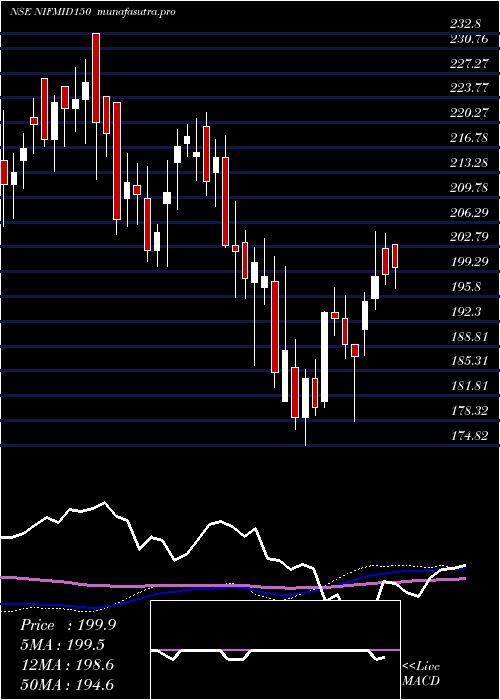
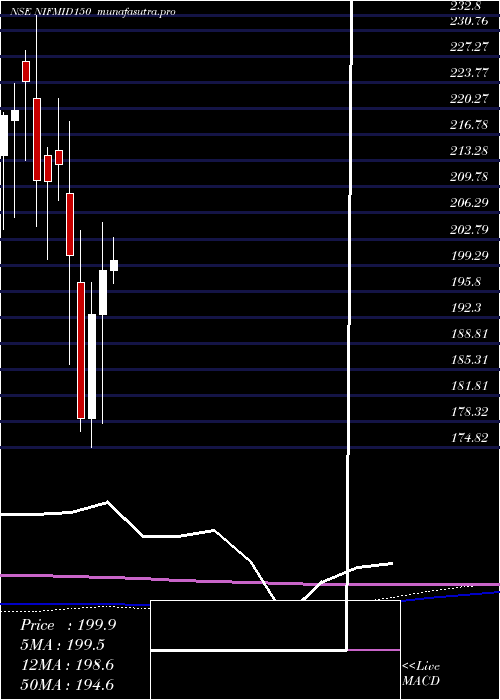
Monthly price and charts UtiamcNifmid150 Strong monthly Stock price targets for UtiamcNifmid150 NIFMID150 are 218.68 and 240.73 | Monthly Target 1 | 202.23 | | Monthly Target 2 | 213.07 | | Monthly Target 3 | 224.27666666667 | | Monthly Target 4 | 235.12 | | Monthly Target 5 | 246.33 |
Monthly price and volumes Utiamc Nifmid150
| Date |
Closing |
Open |
Range |
Volume |
Wed 29 October 2025 |
223.92 (-1%) |
222.37 |
213.43 - 235.48 |
2.5982 times |
Tue 30 September 2025 |
226.18 (7.68%) |
210.04 |
209.00 - 232.01 |
0.4855 times |
Fri 29 August 2025 |
210.04 (-2.4%) |
216.05 |
209.23 - 218.95 |
0.3428 times |
Thu 31 July 2025 |
215.21 (-2.47%) |
224.43 |
214.39 - 224.43 |
0.4247 times |
Mon 30 June 2025 |
220.65 (3.93%) |
213.36 |
208.05 - 221.99 |
0.4561 times |
Fri 30 May 2025 |
212.30 (6.94%) |
198.55 |
188.14 - 218.90 |
0.6823 times |
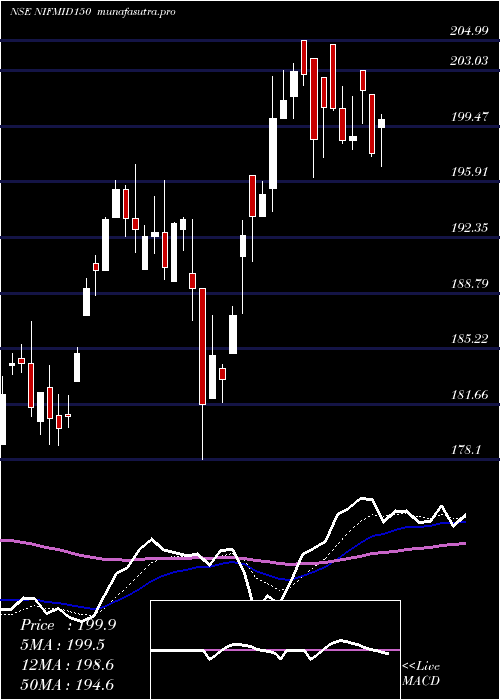
Wed 30 April 2025 |
198.53 (3.06%) |
192.63 |
178.10 - 204.99 |
0.8834 times |
Fri 28 March 2025 |
192.63 (7.8%) |
178.70 |
174.82 - 197.00 |
0.5892 times |
Fri 28 February 2025 |
178.70 (-10.9%) |
197.00 |
177.00 - 203.95 |
3.0075 times |
Fri 31 January 2025 |
200.56 (-5.73%) |
208.95 |
186.00 - 218.50 |
0.5304 times |
Tue 31 December 2024 |
212.74 (1.09%) |
214.66 |
208.00 - 221.70 |
0.4235 times |
DMA SMA EMA moving averages of Utiamc Nifmid150 NIFMID150
DMA (daily moving average) of Utiamc Nifmid150 NIFMID150
| DMA period | DMA value | | 5 day DMA | 221.82 | | 12 day DMA | 220.48 | | 20 day DMA | 220.11 | | 35 day DMA | 218.79 | | 50 day DMA | 217.42 | | 100 day DMA | 217.3 | | 150 day DMA | 211.81 | | 200 day DMA | 206.87 | EMA (exponential moving average) of Utiamc Nifmid150 NIFMID150
| EMA period | EMA current | EMA prev | EMA prev2 | | 5 day EMA | 222.11 | 221.21 | 220.73 | | 12 day EMA | 220.82 | 220.26 | 219.91 | | 20 day EMA | 219.95 | 219.53 | 219.25 | | 35 day EMA | 218.67 | 218.36 | 218.13 | | 50 day EMA | 217.41 | 217.14 | 216.93 |
SMA (simple moving average) of Utiamc Nifmid150 NIFMID150
| SMA period | SMA current | SMA prev | SMA prev2 | | 5 day SMA | 221.82 | 221.2 | 220.86 | | 12 day SMA | 220.48 | 220.04 | 219.65 | | 20 day SMA | 220.11 | 219.46 | 218.91 | | 35 day SMA | 218.79 | 218.52 | 218.28 | | 50 day SMA | 217.42 | 217.21 | 217.03 | | 100 day SMA | 217.3 | 217.22 | 217.14 | | 150 day SMA | 211.81 | 211.59 | 211.37 | | 200 day SMA | 206.87 | 206.81 | 206.75 |
|
|
