UtiamcNif5getf NIF5GETF full analysis,charts,indicators,moving averages,SMA,DMA,EMA,ADX,MACD,RSIUtiamc Nif5getf NIF5GETF WideScreen charts, DMA,SMA,EMA technical analysis, forecast prediction, by indicators ADX,MACD,RSI,CCI NSE stock exchange
Daily price and charts and targets UtiamcNif5getf Strong Daily Stock price targets for UtiamcNif5getf NIF5GETF are 62.73 and 63.96 | Daily Target 1 | 62.38 | | Daily Target 2 | 63.07 | | Daily Target 3 | 63.606666666667 | | Daily Target 4 | 64.3 | | Daily Target 5 | 64.84 |
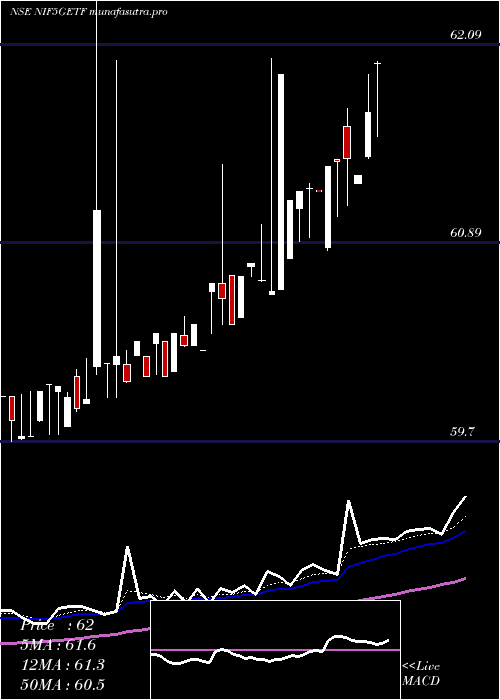
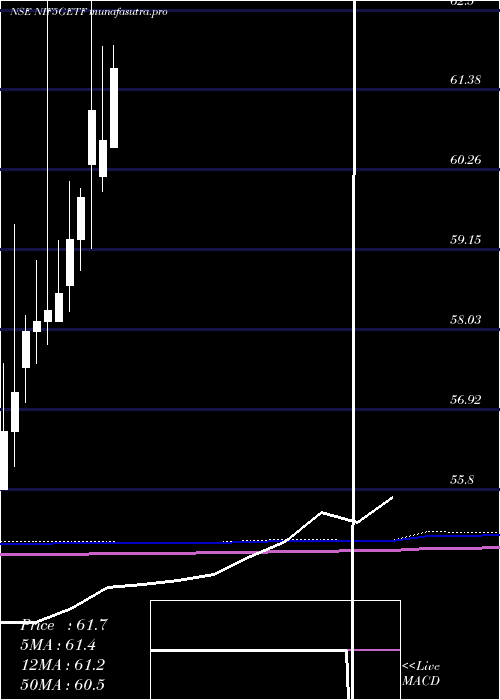
Daily price and volume Utiamc Nif5getf
| Date |
Closing |
Open |
Range |
Volume |
Tue 28 October 2025 |
63.77 (-0.06%) |
64.14 |
62.91 - 64.14 |
1.9543 times |
Mon 27 October 2025 |
63.81 (0.49%) |
63.81 |
62.96 - 64.15 |
0.2794 times |
Fri 24 October 2025 |
63.50 (0.28%) |
63.63 |
62.91 - 64.14 |
3.2691 times |
Thu 23 October 2025 |
63.32 (-1.28%) |
64.14 |
63.02 - 64.14 |
0.1875 times |
Tue 21 October 2025 |
64.14 (1.04%) |
64.14 |
64.14 - 64.14 |
0.0107 times |
Mon 20 October 2025 |
63.48 (-0.16%) |
63.90 |
63.35 - 64.14 |
0.0618 times |
Fri 17 October 2025 |
63.58 (0.84%) |
62.86 |
62.86 - 64.14 |
2.7459 times |
Thu 16 October 2025 |
63.05 (0.08%) |
64.09 |
62.90 - 64.14 |
0.9777 times |
Wed 15 October 2025 |
63.00 (-0.03%) |
63.50 |
62.90 - 64.12 |
0.4542 times |
Tue 14 October 2025 |
63.02 (-0.27%) |
62.81 |
62.81 - 64.14 |
0.0595 times |
Mon 13 October 2025 |
63.19 (-0.49%) |
62.81 |
62.70 - 64.14 |
2.477 times |
Weekly price and charts UtiamcNif5getf Strong weekly Stock price targets for UtiamcNif5getf NIF5GETF are 62.72 and 63.96 | Weekly Target 1 | 62.37 | | Weekly Target 2 | 63.07 | | Weekly Target 3 | 63.61 | | Weekly Target 4 | 64.31 | | Weekly Target 5 | 64.85 |
Weekly price and volumes for Utiamc Nif5getf
| Date |
Closing |
Open |
Range |
Volume |
Tue 28 October 2025 |
63.77 (0.43%) |
63.81 |
62.91 - 64.15 |
0.9247 times |
Fri 24 October 2025 |
63.50 (-0.13%) |
63.90 |
62.91 - 64.14 |
1.461 times |
Fri 17 October 2025 |
63.58 (0.13%) |
62.81 |
62.70 - 64.14 |
2.7796 times |
Fri 10 October 2025 |
63.50 (0.78%) |
63.32 |
62.70 - 65.00 |
2.4607 times |
Fri 03 October 2025 |
63.01 (0.7%) |
62.89 |
62.53 - 63.87 |
0.2527 times |
Fri 26 September 2025 |
62.57 (-0.32%) |
61.51 |
61.51 - 64.40 |
1.3385 times |
Fri 19 September 2025 |
62.77 (-0.59%) |
63.13 |
62.41 - 63.69 |
0.1374 times |
Fri 12 September 2025 |
63.14 (0.49%) |
63.14 |
62.55 - 63.67 |
0.1015 times |
Fri 05 September 2025 |
62.83 (0.08%) |
62.80 |
62.28 - 63.00 |
0.216 times |
Fri 29 August 2025 |
62.78 (-0.24%) |
63.24 |
62.21 - 63.24 |
0.3279 times |
Fri 22 August 2025 |
62.93 (0.67%) |
62.90 |
62.33 - 62.97 |
0.1189 times |

Monthly price and charts UtiamcNif5getf Strong monthly Stock price targets for UtiamcNif5getf NIF5GETF are 63.22 and 65.56 | Monthly Target 1 | 61.47 | | Monthly Target 2 | 62.62 | | Monthly Target 3 | 63.81 | | Monthly Target 4 | 64.96 | | Monthly Target 5 | 66.15 |
Monthly price and volumes Utiamc Nif5getf
| Date |
Closing |
Open |
Range |
Volume |
Tue 28 October 2025 |
63.77 (1.79%) |
62.97 |
62.66 - 65.00 |
3.1165 times |
Tue 30 September 2025 |
62.65 (-0.21%) |
62.80 |
61.51 - 64.40 |
0.8023 times |
Fri 29 August 2025 |
62.78 (-0.03%) |
63.08 |
62.21 - 63.57 |
0.7668 times |
Thu 31 July 2025 |
62.80 (-0.03%) |
62.84 |
62.46 - 63.90 |
2.4616 times |
Mon 30 June 2025 |
62.82 (0.34%) |
62.88 |
61.64 - 63.50 |
0.3723 times |
Fri 30 May 2025 |
62.61 (0.87%) |
62.08 |
61.65 - 65.00 |
1.1117 times |
Wed 30 April 2025 |
62.07 (2.31%) |
60.58 |
60.58 - 62.35 |
0.2579 times |
Fri 28 March 2025 |
60.67 (-0.69%) |
60.17 |
59.96 - 61.99 |
0.5516 times |
Fri 28 February 2025 |
61.09 (2.02%) |
60.34 |
59.16 - 62.90 |
0.1771 times |
Fri 31 January 2025 |
59.88 (1%) |
59.29 |
58.85 - 60.00 |
0.3821 times |
Tue 31 December 2024 |
59.29 (1.3%) |
58.65 |
58.28 - 60.10 |
5.0749 times |
DMA SMA EMA moving averages of Utiamc Nif5getf NIF5GETF
DMA (daily moving average) of Utiamc Nif5getf NIF5GETF
| DMA period | DMA value | | 5 day DMA | 63.71 | | 12 day DMA | 63.45 | | 20 day DMA | 63.27 | | 35 day DMA | 63.19 | | 50 day DMA | 63.04 | | 100 day DMA | 62.94 | | 150 day DMA | 62.57 | | 200 day DMA | 61.86 | EMA (exponential moving average) of Utiamc Nif5getf NIF5GETF
| EMA period | EMA current | EMA prev | EMA prev2 | | 5 day EMA | 63.66 | 63.61 | 63.51 | | 12 day EMA | 63.5 | 63.45 | 63.39 | | 20 day EMA | 63.38 | 63.34 | 63.29 | | 35 day EMA | 63.21 | 63.18 | 63.14 | | 50 day EMA | 63.09 | 63.06 | 63.03 |
SMA (simple moving average) of Utiamc Nif5getf NIF5GETF
| SMA period | SMA current | SMA prev | SMA prev2 | | 5 day SMA | 63.71 | 63.65 | 63.6 | | 12 day SMA | 63.45 | 63.46 | 63.38 | | 20 day SMA | 63.27 | 63.21 | 63.19 | | 35 day SMA | 63.19 | 63.17 | 63.14 | | 50 day SMA | 63.04 | 63.02 | 63 | | 100 day SMA | 62.94 | 62.93 | 62.92 | | 150 day SMA | 62.57 | 62.54 | 62.52 | | 200 day SMA | 61.86 | 61.83 | 61.81 |
|
|
