SecRed NIDOZC26_N7 full analysis,charts,indicators,moving averages,SMA,DMA,EMA,ADX,MACD,RSISec Red NIDOZC26_N7 WideScreen charts, DMA,SMA,EMA technical analysis, forecast prediction, by indicators ADX,MACD,RSI,CCI NSE stock exchange
Daily price and charts and targets SecRed Strong Daily Stock price targets for SecRed NIDOZC26_N7 are 2135.11 and 2564.9 | Daily Target 1 | 1776.95 | | Daily Target 2 | 2063.47 | | Daily Target 3 | 2206.7366666667 | | Daily Target 4 | 2493.26 | | Daily Target 5 | 2636.53 |
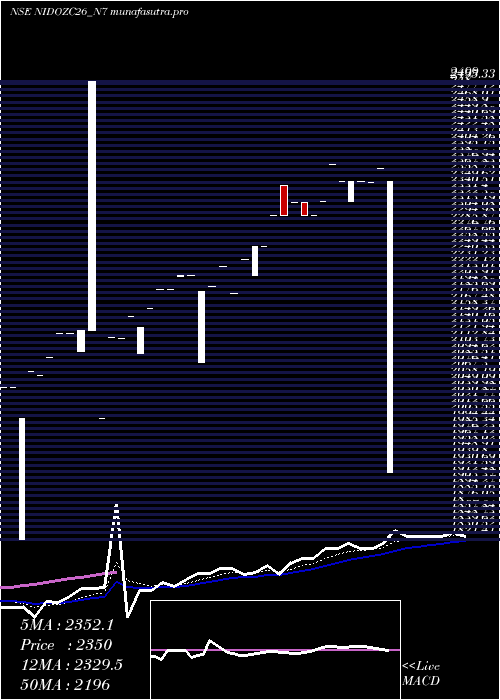
Daily price and volume Sec Red
| Date |
Closing |
Open |
Range |
Volume |
Fri 24 October 2025 |
2350.00 (-0.8%) |
1920.21 |
1920.21 - 2350.00 |
0.0635 times |
Fri 17 October 2025 |
2369.00 (0.85%) |
2369.00 |
2369.00 - 2369.00 |
0.9841 times |
Thu 09 October 2025 |
2349.00 (-0.04%) |
2349.00 |
2349.00 - 2349.00 |
0.0317 times |
Wed 08 October 2025 |
2350.00 (0%) |
2350.00 |
2350.00 - 2350.00 |
5.2381 times |
Tue 07 October 2025 |
2350.00 (0%) |
2321.00 |
2321.00 - 2350.00 |
0.0635 times |
Mon 15 September 2025 |
2350.00 (-1.05%) |
2350.00 |
2350.00 - 2350.00 |
0.6032 times |
Wed 20 August 2025 |
2375.00 (2.32%) |
2375.00 |
2375.00 - 2375.00 |
0.3492 times |
Mon 18 August 2025 |
2321.20 (0.91%) |
2321.20 |
2321.20 - 2321.20 |
1.2381 times |
Wed 13 August 2025 |
2300.20 (0%) |
2300.20 |
2300.20 - 2300.20 |
0.0317 times |
Mon 11 August 2025 |
2300.20 (-0.85%) |
2320.00 |
2300.20 - 2320.00 |
1.3968 times |
Thu 07 August 2025 |
2320.00 (0.86%) |
2320.00 |
2320.00 - 2320.00 |
0.8254 times |
Weekly price and charts SecRed Strong weekly Stock price targets for SecRed NIDOZC26_N7 are 2135.11 and 2564.9 | Weekly Target 1 | 1776.95 | | Weekly Target 2 | 2063.47 | | Weekly Target 3 | 2206.7366666667 | | Weekly Target 4 | 2493.26 | | Weekly Target 5 | 2636.53 |
Weekly price and volumes for Sec Red
| Date |
Closing |
Open |
Range |
Volume |
Fri 24 October 2025 |
2350.00 (-0.8%) |
1920.21 |
1920.21 - 2350.00 |
0.0195 times |
Fri 17 October 2025 |
2369.00 (-0.25%) |
2350.00 |
2321.00 - 2369.00 |
2.1248 times |
Wed 20 August 2025 |
2375.00 (3.25%) |
2321.20 |
2321.20 - 2375.00 |
0.4873 times |
Wed 13 August 2025 |
2300.20 (-0.85%) |
2320.00 |
2300.20 - 2320.00 |
0.4386 times |
Thu 07 August 2025 |
2320.00 (0.86%) |
2320.00 |
2320.00 - 2320.00 |
0.2534 times |
Fri 01 August 2025 |
2300.20 (2%) |
2300.00 |
2300.00 - 2345.00 |
2.2515 times |
Thu 12 June 2025 |
2255.00 (0.89%) |
2211.25 |
2211.25 - 2255.00 |
0.1559 times |
Tue 04 March 2025 |
2235.00 (2.29%) |
2235.00 |
2235.00 - 2235.00 |
0.8577 times |
Tue 18 February 2025 |
2185.00 (-1.8%) |
2185.00 |
2185.00 - 2185.00 |
0.9747 times |
Tue 04 February 2025 |
2225.00 (1.37%) |
2225.00 |
2225.00 - 2225.00 |
2.4366 times |
Wed 29 January 2025 |
2195.00 (-0.72%) |
2083.00 |
2083.00 - 2195.00 |
1.5692 times |

Monthly price and charts SecRed Strong monthly Stock price targets for SecRed NIDOZC26_N7 are 2135.11 and 2583.9 | Monthly Target 1 | 1764.28 | | Monthly Target 2 | 2057.14 | | Monthly Target 3 | 2213.07 | | Monthly Target 4 | 2505.93 | | Monthly Target 5 | 2661.86 |
Monthly price and volumes Sec Red
| Date |
Closing |
Open |
Range |
Volume |
Fri 24 October 2025 |
2350.00 (0%) |
2321.00 |
1920.21 - 2369.00 |
1.2362 times |
Mon 15 September 2025 |
2350.00 (-1.05%) |
2350.00 |
2350.00 - 2350.00 |
0.1169 times |
Wed 20 August 2025 |
2375.00 (3.26%) |
2345.00 |
2300.20 - 2375.00 |
1.8758 times |
Thu 10 July 2025 |
2300.00 (2%) |
2300.00 |
2300.00 - 2300.00 |
0.2891 times |
Thu 12 June 2025 |
2255.00 (0%) |
2255.00 |
2255.00 - 2255.00 |
0.0123 times |
Mon 12 May 2025 |
2255.00 (0.89%) |
2211.25 |
2211.25 - 2255.00 |
0.0861 times |
Tue 04 March 2025 |
2235.00 (2.29%) |
2235.00 |
2235.00 - 2235.00 |
0.5412 times |
Tue 18 February 2025 |
2185.00 (-0.46%) |
2225.00 |
2185.00 - 2225.00 |
2.1525 times |
Wed 29 January 2025 |
2195.00 (2.81%) |
2163.00 |
2083.00 - 2211.00 |
3.0689 times |
Thu 26 December 2024 |
2135.00 (6.79%) |
2119.00 |
2096.50 - 2150.25 |
0.6212 times |
Thu 21 November 2024 |
1999.20 (-20%) |
1999.20 |
1999.20 - 1999.20 |
0.0308 times |

DMA SMA EMA moving averages of Sec Red NIDOZC26_N7
DMA (daily moving average) of Sec Red NIDOZC26_N7
| DMA period | DMA value | | 5 day DMA | 2353.6 | | 12 day DMA | 2336.23 | | 20 day DMA | 2293.64 | | 35 day DMA | 2238.01 | | 50 day DMA | 2187.77 | | 100 day DMA | | | 150 day DMA | | | 200 day DMA | | EMA (exponential moving average) of Sec Red NIDOZC26_N7
| EMA period | EMA current | EMA prev | EMA prev2 | | 5 day EMA | 2352.08 | 2353.12 | 2345.18 | | 12 day EMA | 2329.48 | 2325.75 | 2317.89 | | 20 day EMA | 2298.77 | 2293.38 | 2285.42 | | 35 day EMA | 2245.61 | 2239.46 | 2231.83 | | 50 day EMA | 2191.52 | 2185.05 | 2177.55 |
SMA (simple moving average) of Sec Red NIDOZC26_N7
| SMA period | SMA current | SMA prev | SMA prev2 | | 5 day SMA | 2353.6 | 2353.6 | 2354.8 | | 12 day SMA | 2336.23 | 2332.07 | 2322.57 | | 20 day SMA | 2293.64 | 2286.69 | 2278.79 | | 35 day SMA | 2238.01 | 2229.83 | 2221.26 | | 50 day SMA | 2187.77 | 2181.37 | 2174.79 | | 100 day SMA | | 150 day SMA | | 200 day SMA |
|
|
