NrbIndus NIBL_BE full analysis,charts,indicators,moving averages,SMA,DMA,EMA,ADX,MACD,RSINrb Indus NIBL_BE WideScreen charts, DMA,SMA,EMA technical analysis, forecast prediction, by indicators ADX,MACD,RSI,CCI NSE stock exchange
Daily price and charts and targets NrbIndus Strong Daily Stock price targets for NrbIndus NIBL_BE are 26.6 and 27.29 | Daily Target 1 | 26.04 | | Daily Target 2 | 26.46 | | Daily Target 3 | 26.73 | | Daily Target 4 | 27.15 | | Daily Target 5 | 27.42 |
Daily price and volume Nrb Indus
| Date |
Closing |
Open |
Range |
Volume |
Thu 04 September 2025 |
26.88 (-0.63%) |
26.61 |
26.31 - 27.00 |
0.1862 times |
Wed 03 September 2025 |
27.05 (-0.07%) |
27.35 |
26.50 - 28.00 |
1.0362 times |
Tue 02 September 2025 |
27.07 (2.73%) |
25.76 |
25.76 - 27.47 |
1.333 times |
Mon 01 September 2025 |
26.35 (0.53%) |
25.69 |
25.12 - 27.00 |
0.4592 times |
Fri 29 August 2025 |
26.21 (0.27%) |
25.06 |
25.06 - 26.28 |
0.7207 times |
Thu 28 August 2025 |
26.14 (1.67%) |
25.71 |
25.20 - 26.39 |
0.4005 times |
Tue 26 August 2025 |
25.71 (-1.98%) |
26.50 |
25.01 - 26.63 |
0.3854 times |
Mon 25 August 2025 |
26.23 (0.5%) |
25.22 |
25.22 - 26.98 |
0.7833 times |
Fri 22 August 2025 |
26.10 (-0.65%) |
25.11 |
25.11 - 26.60 |
0.2266 times |
Thu 21 August 2025 |
26.27 (2.82%) |
25.65 |
25.00 - 26.80 |
4.4689 times |
Wed 20 August 2025 |
25.55 (-0.54%) |
24.40 |
24.40 - 26.43 |
0.3875 times |
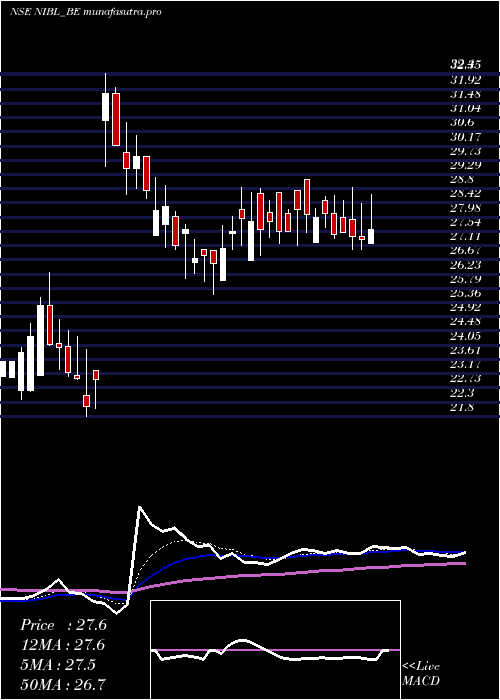
Weekly price and charts NrbIndus Strong weekly Stock price targets for NrbIndus NIBL_BE are 26 and 28.88 | Weekly Target 1 | 23.79 | | Weekly Target 2 | 25.33 | | Weekly Target 3 | 26.666666666667 | | Weekly Target 4 | 28.21 | | Weekly Target 5 | 29.55 |
Weekly price and volumes for Nrb Indus
| Date |
Closing |
Open |
Range |
Volume |
Thu 04 September 2025 |
26.88 (2.56%) |
25.69 |
25.12 - 28.00 |
0.5131 times |
Fri 29 August 2025 |
26.21 (0.42%) |
25.22 |
25.01 - 26.98 |
0.3898 times |
Fri 22 August 2025 |
26.10 (-2.21%) |
26.30 |
24.40 - 27.45 |
1.227 times |
Thu 14 August 2025 |
26.69 (10.29%) |
25.41 |
25.40 - 28.98 |
1.8863 times |
Fri 08 August 2025 |
24.20 (8.42%) |
22.89 |
21.75 - 24.20 |
1.0261 times |
Fri 01 August 2025 |
22.32 (-11.04%) |
24.95 |
21.62 - 25.99 |
2.1969 times |
Fri 25 July 2025 |
25.09 (-8.56%) |
27.02 |
24.91 - 27.74 |
1.108 times |
Fri 18 July 2025 |
27.44 (-0.29%) |
27.90 |
27.00 - 28.89 |
0.7091 times |
Fri 11 July 2025 |
27.52 (-2.48%) |
29.15 |
27.19 - 29.15 |
0.3454 times |
Fri 04 July 2025 |
28.22 (1.36%) |
28.70 |
26.80 - 28.85 |
0.5982 times |
Fri 27 June 2025 |
27.84 (3.92%) |
26.96 |
25.60 - 28.90 |
1.0172 times |
Monthly price and charts NrbIndus Strong monthly Stock price targets for NrbIndus NIBL_BE are 26 and 28.88 | Monthly Target 1 | 23.79 | | Monthly Target 2 | 25.33 | | Monthly Target 3 | 26.666666666667 | | Monthly Target 4 | 28.21 | | Monthly Target 5 | 29.55 |
Monthly price and volumes Nrb Indus
| Date |
Closing |
Open |
Range |
Volume |
Thu 04 September 2025 |
26.88 (2.56%) |
25.69 |
25.12 - 28.00 |
0.1712 times |
Fri 29 August 2025 |
26.21 (17.11%) |
21.62 |
21.62 - 28.98 |
1.5664 times |
Thu 31 July 2025 |
22.38 (-18.88%) |
28.13 |
21.70 - 29.15 |
1.551 times |
Mon 30 June 2025 |
27.59 (20.06%) |
30.96 |
25.60 - 32.40 |
2.0801 times |
Thu 13 March 2025 |
22.98 (-2.38%) |
22.65 |
21.86 - 26.28 |
0.3998 times |
Fri 28 February 2025 |
23.54 (-0.25%) |
23.68 |
22.52 - 23.68 |
0.3841 times |
Fri 31 January 2025 |
23.60 (-1.67%) |
24.81 |
21.20 - 27.03 |
1.1742 times |
Tue 31 December 2024 |
24.00 (-12.95%) |
27.61 |
23.25 - 28.48 |
1.8099 times |
Fri 29 November 2024 |
27.57 (2.38%) |
27.47 |
25.21 - 29.64 |
0.7883 times |
Thu 31 October 2024 |
26.93 (-17.27%) |
26.30 |
25.99 - 27.78 |
0.075 times |
Fri 22 March 2024 |
32.55 (3.66%) |
31.40 |
28.65 - 34.15 |
0.6927 times |
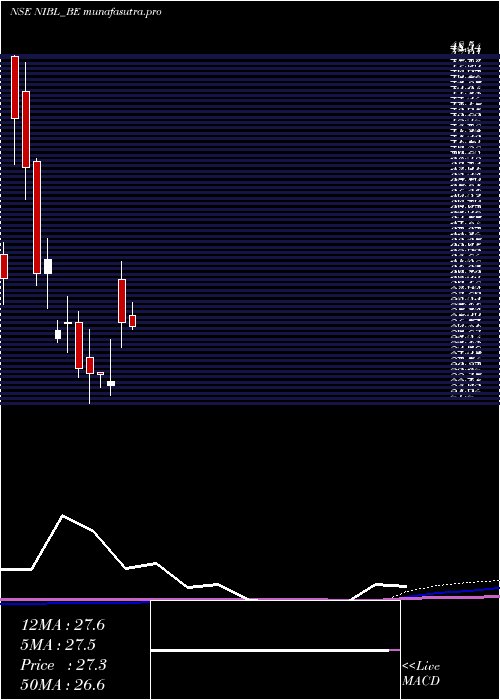
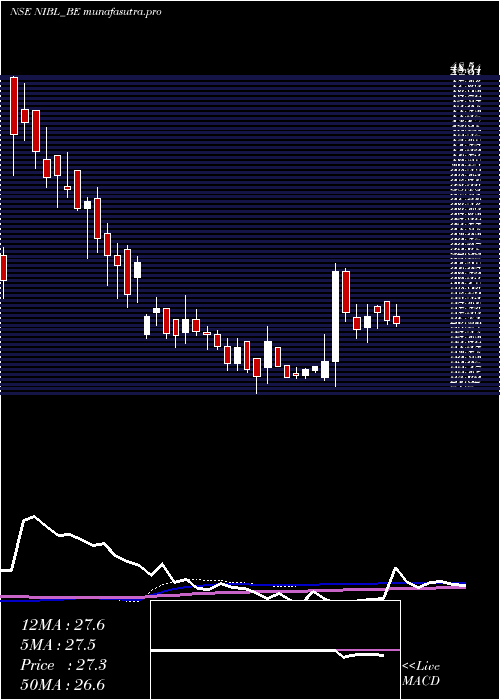
DMA SMA EMA moving averages of Nrb Indus NIBL_BE
DMA (daily moving average) of Nrb Indus NIBL_BE
| DMA period | DMA value | | 5 day DMA | 26.71 | | 12 day DMA | 26.27 | | 20 day DMA | 25.87 | | 35 day DMA | 25.47 | | 50 day DMA | 26.15 | | 100 day DMA | 25.52 | | 150 day DMA | 25.53 | | 200 day DMA | 27.72 | EMA (exponential moving average) of Nrb Indus NIBL_BE
| EMA period | EMA current | EMA prev | EMA prev2 | | 5 day EMA | 26.74 | 26.67 | 26.48 | | 12 day EMA | 26.35 | 26.25 | 26.11 | | 20 day EMA | 26.07 | 25.99 | 25.88 | | 35 day EMA | 26.22 | 26.18 | 26.13 | | 50 day EMA | 26.27 | 26.24 | 26.21 |
SMA (simple moving average) of Nrb Indus NIBL_BE
| SMA period | SMA current | SMA prev | SMA prev2 | | 5 day SMA | 26.71 | 26.56 | 26.3 | | 12 day SMA | 26.27 | 26.23 | 26.2 | | 20 day SMA | 25.87 | 25.64 | 25.42 | | 35 day SMA | 25.47 | 25.48 | 25.49 | | 50 day SMA | 26.15 | 26.15 | 26.14 | | 100 day SMA | 25.52 | 25.49 | 25.44 | | 150 day SMA | 25.53 | 25.54 | 25.54 | | 200 day SMA | 27.72 | 27.79 | 27.85 |
|
|
