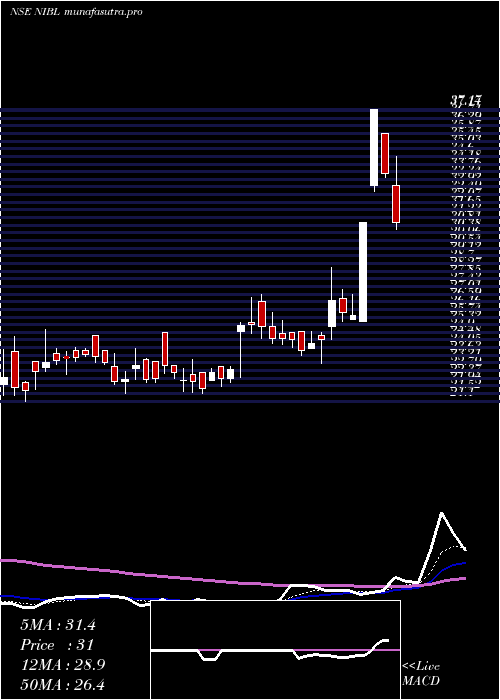
NrbIndustrial NIBL full analysis,charts,indicators,moving averages,SMA,DMA,EMA,ADX,MACD,RSINrb Industrial NIBL WideScreen charts, DMA,SMA,EMA technical analysis, forecast prediction, by indicators ADX,MACD,RSI,CCI NSE stock exchange
operates under Other Industrial Goods sector
Daily price and charts and targets NrbIndustrial Strong Daily Stock price targets for NrbIndustrial NIBL are 29.45 and 31.22 | Daily Target 1 | 29.11 | | Daily Target 2 | 29.79 | | Daily Target 3 | 30.88 | | Daily Target 4 | 31.56 | | Daily Target 5 | 32.65 |
Daily price and volume Nrb Industrial
| Date |
Closing |
Open |
Range |
Volume |
Tue 28 October 2025 |
30.47 (-2.31%) |
30.71 |
30.20 - 31.97 |
0.2898 times |
Mon 27 October 2025 |
31.19 (-2.44%) |
32.60 |
31.01 - 33.45 |
0.4123 times |
Fri 24 October 2025 |
31.97 (0.25%) |
32.40 |
31.30 - 33.00 |
0.3361 times |
Thu 23 October 2025 |
31.89 (-4.03%) |
34.00 |
31.11 - 34.00 |
1.4215 times |
Tue 21 October 2025 |
33.23 (15.34%) |
29.51 |
28.01 - 34.50 |
6.9981 times |
Mon 20 October 2025 |
28.81 (-0.03%) |
28.75 |
27.68 - 29.80 |
0.0384 times |
Fri 17 October 2025 |
28.82 (-0.14%) |
29.68 |
28.21 - 29.68 |
0.1546 times |
Thu 16 October 2025 |
28.86 (-2.43%) |
29.90 |
28.61 - 29.90 |
0.09 times |
Wed 15 October 2025 |
29.58 (3.03%) |
28.50 |
28.21 - 29.94 |
0.12 times |
Tue 14 October 2025 |
28.71 (-2.28%) |
30.60 |
28.40 - 30.60 |
0.1392 times |
Mon 13 October 2025 |
29.38 (-4.98%) |
30.50 |
28.30 - 30.98 |
0.5442 times |
Weekly price and charts NrbIndustrial Strong weekly Stock price targets for NrbIndustrial NIBL are 28.71 and 31.96 | Weekly Target 1 | 28.12 | | Weekly Target 2 | 29.3 | | Weekly Target 3 | 31.373333333333 | | Weekly Target 4 | 32.55 | | Weekly Target 5 | 34.62 |
Weekly price and volumes for Nrb Industrial
| Date |
Closing |
Open |
Range |
Volume |
Tue 28 October 2025 |
30.47 (-4.69%) |
32.60 |
30.20 - 33.45 |
0.134 times |
Fri 24 October 2025 |
31.97 (10.93%) |
28.75 |
27.68 - 34.50 |
1.6785 times |
Fri 17 October 2025 |
28.82 (-6.79%) |
30.50 |
28.21 - 30.98 |
0.2 times |
Fri 10 October 2025 |
30.92 (10.27%) |
28.04 |
26.15 - 31.75 |
0.3137 times |
Fri 03 October 2025 |
28.04 (1.37%) |
27.00 |
26.25 - 29.39 |
0.136 times |
Fri 26 September 2025 |
27.66 (-13.43%) |
32.38 |
27.20 - 32.38 |
0.2785 times |
Fri 19 September 2025 |
31.95 (6.61%) |
30.29 |
28.17 - 34.09 |
1.0471 times |
Fri 12 September 2025 |
29.97 (-3.2%) |
24.06 |
24.06 - 31.00 |
1.009 times |
Thu 05 June 2025 |
30.96 (19.91%) |
25.50 |
25.50 - 37.17 |
4.961 times |
Fri 30 May 2025 |
25.82 (7.99%) |
24.02 |
23.20 - 28.50 |
0.2421 times |
Fri 23 May 2025 |
23.91 (-5.64%) |
26.58 |
23.60 - 26.96 |
0.2012 times |

Monthly price and charts NrbIndustrial Strong monthly Stock price targets for NrbIndustrial NIBL are 28.31 and 36.66 | Monthly Target 1 | 22.02 | | Monthly Target 2 | 26.25 | | Monthly Target 3 | 30.373333333333 | | Monthly Target 4 | 34.6 | | Monthly Target 5 | 38.72 |
Monthly price and volumes Nrb Industrial
| Date |
Closing |
Open |
Range |
Volume |
Tue 28 October 2025 |
30.47 (8.16%) |
27.60 |
26.15 - 34.50 |
0.7203 times |
Tue 30 September 2025 |
28.17 (-9.01%) |
24.06 |
24.06 - 34.09 |
0.7285 times |
Thu 05 June 2025 |
30.96 (19.91%) |
25.50 |
25.50 - 37.17 |
1.4983 times |
Fri 30 May 2025 |
25.82 (15.84%) |
23.28 |
21.52 - 28.50 |
0.2263 times |
Wed 30 April 2025 |
22.29 (7.73%) |
21.00 |
20.69 - 26.00 |
0.7332 times |
Fri 28 March 2025 |
20.69 (-24.3%) |
24.04 |
19.50 - 28.49 |
0.651 times |
Wed 30 October 2024 |
27.33 (-22.05%) |
35.79 |
25.41 - 39.90 |
1.0241 times |
Mon 30 September 2024 |
35.06 (-8%) |
37.36 |
33.80 - 45.90 |
1.6215 times |
Fri 30 August 2024 |
38.11 (-13.21%) |
44.00 |
36.55 - 47.17 |
1.3301 times |
Wed 31 July 2024 |
43.91 (17.97%) |
37.96 |
34.12 - 50.40 |
1.4668 times |
Fri 28 June 2024 |
37.22 (10.12%) |
34.60 |
29.80 - 38.89 |
0.4601 times |

DMA SMA EMA moving averages of Nrb Industrial NIBL
DMA (daily moving average) of Nrb Industrial NIBL
| DMA period | DMA value | | 5 day DMA | 31.75 | | 12 day DMA | 30.32 | | 20 day DMA | 29.59 | | 35 day DMA | 29.66 | | 50 day DMA | 28.92 | | 100 day DMA | 26.91 | | 150 day DMA | 30.46 | | 200 day DMA | 31.95 | EMA (exponential moving average) of Nrb Industrial NIBL
| EMA period | EMA current | EMA prev | EMA prev2 | | 5 day EMA | 30.98 | 31.24 | 31.26 | | 12 day EMA | 30.49 | 30.49 | 30.36 | | 20 day EMA | 30.04 | 30 | 29.87 | | 35 day EMA | 29.25 | 29.18 | 29.06 | | 50 day EMA | 28.7 | 28.63 | 28.53 |
SMA (simple moving average) of Nrb Industrial NIBL
| SMA period | SMA current | SMA prev | SMA prev2 | | 5 day SMA | 31.75 | 31.42 | 30.94 | | 12 day SMA | 30.32 | 30.34 | 30.21 | | 20 day SMA | 29.59 | 29.45 | 29.31 | | 35 day SMA | 29.66 | 29.67 | 29.74 | | 50 day SMA | 28.92 | 28.82 | 28.65 | | 100 day SMA | 26.91 | 26.97 | 27 | | 150 day SMA | 30.46 | 30.54 | 30.6 | | 200 day SMA | 31.95 | 31.97 | 32 |
|
|
