NakodaGroup NGIL full analysis,charts,indicators,moving averages,SMA,DMA,EMA,ADX,MACD,RSINakoda Group NGIL WideScreen charts, DMA,SMA,EMA technical analysis, forecast prediction, by indicators ADX,MACD,RSI,CCI NSE stock exchange
Daily price and charts and targets NakodaGroup Strong Daily Stock price targets for NakodaGroup NGIL are 28.46 and 29.9 | Daily Target 1 | 28.18 | | Daily Target 2 | 28.74 | | Daily Target 3 | 29.616666666667 | | Daily Target 4 | 30.18 | | Daily Target 5 | 31.06 |
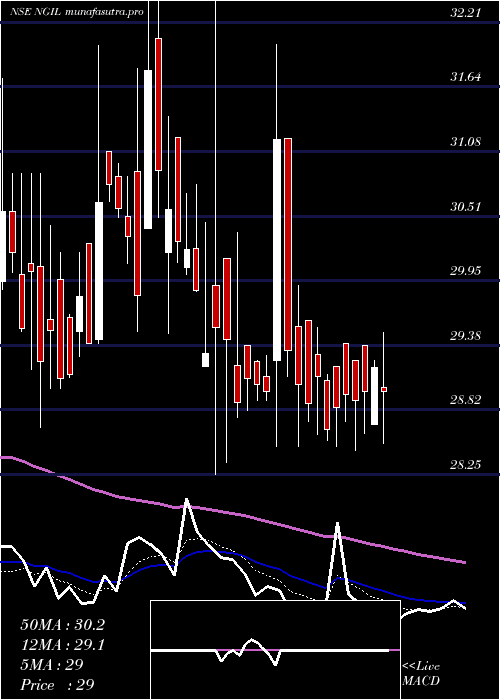
Daily price and volume Nakoda Group
| Date |
Closing |
Open |
Range |
Volume |
Tue 28 October 2025 |
29.31 (-1.81%) |
30.49 |
29.05 - 30.49 |
0.3163 times |
Mon 27 October 2025 |
29.85 (-1.35%) |
30.01 |
29.50 - 30.97 |
0.3001 times |
Fri 24 October 2025 |
30.26 (0.07%) |
30.81 |
29.50 - 30.81 |
0.2161 times |
Thu 23 October 2025 |
30.24 (0.77%) |
30.01 |
29.20 - 30.90 |
0.2971 times |
Tue 21 October 2025 |
30.01 (-0.86%) |
30.50 |
29.81 - 30.50 |
0.0713 times |
Mon 20 October 2025 |
30.27 (2.06%) |
28.71 |
28.55 - 30.56 |
0.5703 times |
Fri 17 October 2025 |
29.66 (1.82%) |
29.14 |
28.71 - 29.90 |
0.2202 times |
Thu 16 October 2025 |
29.13 (2.79%) |
28.04 |
27.81 - 29.75 |
0.5311 times |
Wed 15 October 2025 |
28.34 (-1.25%) |
29.70 |
27.71 - 29.70 |
0.6063 times |
Tue 14 October 2025 |
28.70 (-6.7%) |
31.43 |
25.79 - 31.43 |
6.8711 times |
Mon 13 October 2025 |
30.76 (-3.09%) |
31.74 |
30.47 - 32.40 |
0.8442 times |
Weekly price and charts NakodaGroup Strong weekly Stock price targets for NakodaGroup NGIL are 28.22 and 30.14 | Weekly Target 1 | 27.86 | | Weekly Target 2 | 28.58 | | Weekly Target 3 | 29.776666666667 | | Weekly Target 4 | 30.5 | | Weekly Target 5 | 31.7 |
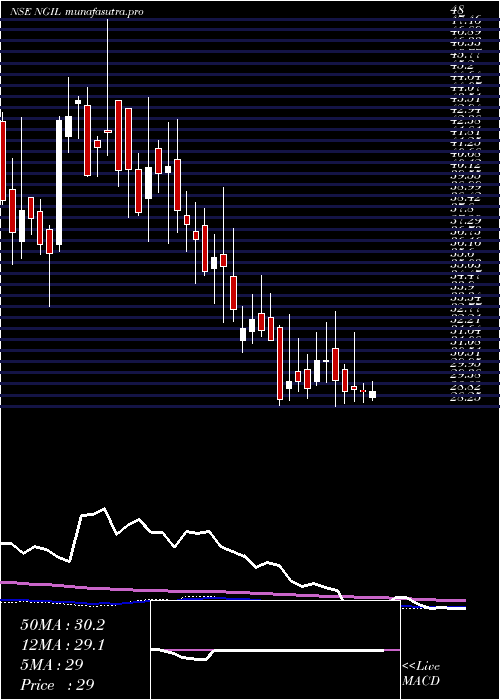
Weekly price and volumes for Nakoda Group
| Date |
Closing |
Open |
Range |
Volume |
Tue 28 October 2025 |
29.31 (-3.14%) |
30.01 |
29.05 - 30.97 |
0.0418 times |
Fri 24 October 2025 |
30.26 (2.02%) |
28.71 |
28.55 - 30.90 |
0.0784 times |
Fri 17 October 2025 |
29.66 (-6.55%) |
31.74 |
25.79 - 32.40 |
0.6156 times |
Fri 10 October 2025 |
31.74 (-4.4%) |
32.81 |
31.46 - 34.43 |
0.2847 times |
Fri 03 October 2025 |
33.20 (13.39%) |
29.85 |
28.90 - 35.41 |
1.2805 times |
Fri 26 September 2025 |
29.28 (-8.01%) |
31.20 |
28.75 - 32.75 |
0.1512 times |
Fri 19 September 2025 |
31.83 (-6.46%) |
34.02 |
31.15 - 35.05 |
0.5391 times |
Fri 12 September 2025 |
34.03 (9.18%) |
32.50 |
32.25 - 37.30 |
2.4894 times |
Fri 05 September 2025 |
31.17 (2.87%) |
30.45 |
29.53 - 38.00 |
2.2984 times |
Fri 29 August 2025 |
30.30 (10.71%) |
26.76 |
26.61 - 32.84 |
2.2209 times |
Fri 22 August 2025 |
27.37 (5.39%) |
25.97 |
25.97 - 27.84 |
0.0788 times |
Monthly price and charts NakodaGroup Strong monthly Stock price targets for NakodaGroup NGIL are 22.74 and 32.36 | Monthly Target 1 | 20.55 | | Monthly Target 2 | 24.93 | | Monthly Target 3 | 30.17 | | Monthly Target 4 | 34.55 | | Monthly Target 5 | 39.79 |
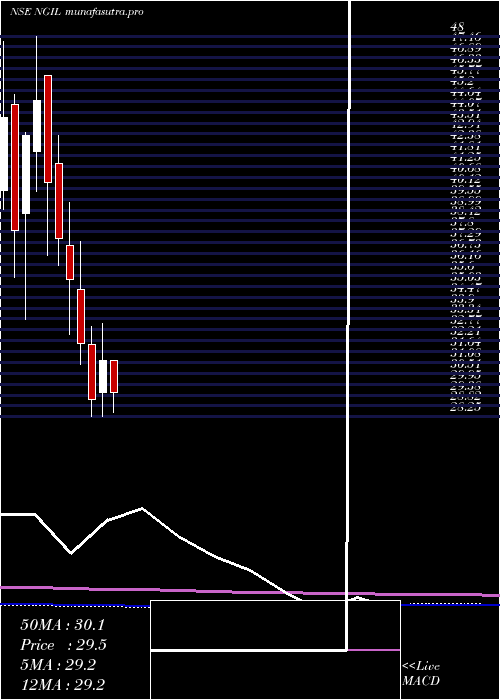
Monthly price and volumes Nakoda Group
| Date |
Closing |
Open |
Range |
Volume |
Tue 28 October 2025 |
29.31 (-14.45%) |
34.50 |
25.79 - 35.41 |
0.747 times |
Tue 30 September 2025 |
34.26 (13.07%) |
30.45 |
28.75 - 38.00 |
3.4657 times |
Fri 29 August 2025 |
30.30 (5.57%) |
29.07 |
25.61 - 32.84 |
1.6907 times |
Thu 31 July 2025 |
28.70 (-7.95%) |
31.19 |
28.45 - 32.98 |
0.4777 times |
Mon 30 June 2025 |
31.18 (7.04%) |
29.50 |
28.25 - 33.10 |
0.403 times |
Fri 30 May 2025 |
29.13 (-9.11%) |
32.01 |
28.29 - 32.95 |
0.2612 times |
Wed 30 April 2025 |
32.05 (-9.41%) |
34.88 |
30.97 - 37.34 |
0.3864 times |
Fri 28 March 2025 |
35.38 (-5.68%) |
37.14 |
32.51 - 39.39 |
0.5163 times |
Fri 28 February 2025 |
37.51 (-7.18%) |
41.39 |
36.12 - 42.87 |
0.4472 times |
Fri 31 January 2025 |
40.41 (-9.6%) |
46.00 |
36.65 - 46.00 |
1.605 times |
Tue 31 December 2024 |
44.70 (4.34%) |
42.01 |
39.96 - 48.00 |
1.2988 times |
DMA SMA EMA moving averages of Nakoda Group NGIL
DMA (daily moving average) of Nakoda Group NGIL
| DMA period | DMA value | | 5 day DMA | 29.93 | | 12 day DMA | 29.86 | | 20 day DMA | 30.92 | | 35 day DMA | 31.79 | | 50 day DMA | 30.96 | | 100 day DMA | 30.06 | | 150 day DMA | 30.63 | | 200 day DMA | 32.64 | EMA (exponential moving average) of Nakoda Group NGIL
| EMA period | EMA current | EMA prev | EMA prev2 | | 5 day EMA | 29.78 | 30.02 | 30.1 | | 12 day EMA | 30.14 | 30.29 | 30.37 | | 20 day EMA | 30.49 | 30.61 | 30.69 | | 35 day EMA | 30.51 | 30.58 | 30.62 | | 50 day EMA | 30.52 | 30.57 | 30.6 |
SMA (simple moving average) of Nakoda Group NGIL
| SMA period | SMA current | SMA prev | SMA prev2 | | 5 day SMA | 29.93 | 30.13 | 30.09 | | 12 day SMA | 29.86 | 30.12 | 30.31 | | 20 day SMA | 30.92 | 30.92 | 30.95 | | 35 day SMA | 31.79 | 31.84 | 31.9 | | 50 day SMA | 30.96 | 30.9 | 30.82 | | 100 day SMA | 30.06 | 30.07 | 30.07 | | 150 day SMA | 30.63 | 30.66 | 30.7 | | 200 day SMA | 32.64 | 32.7 | 32.76 |
|
|
