NewgenSoftware NEWGEN full analysis,charts,indicators,moving averages,SMA,DMA,EMA,ADX,MACD,RSINewgen Software NEWGEN WideScreen charts, DMA,SMA,EMA technical analysis, forecast prediction, by indicators ADX,MACD,RSI,CCI NSE stock exchange
Daily price and charts and targets NewgenSoftware Strong Daily Stock price targets for NewgenSoftware NEWGEN are 947.28 and 1064.28 | Daily Target 1 | 852.85 | | Daily Target 2 | 924.7 | | Daily Target 3 | 969.85 | | Daily Target 4 | 1041.7 | | Daily Target 5 | 1086.85 |
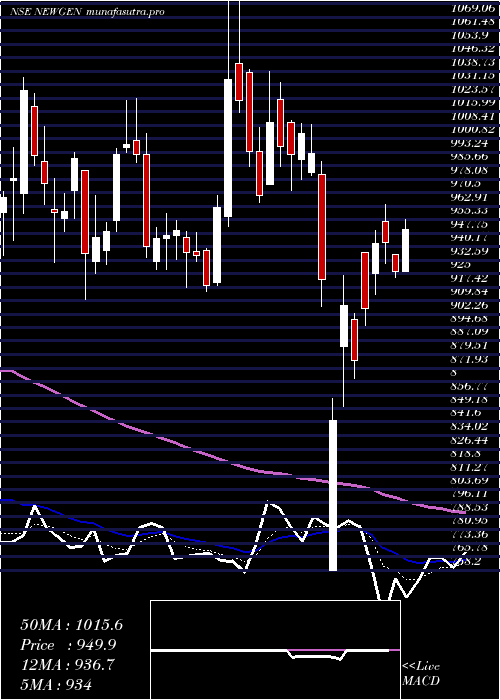
Daily price and volume Newgen Software
| Date |
Closing |
Open |
Range |
Volume |
Tue 28 October 2025 |
996.55 (11.19%) |
899.95 |
898.00 - 1015.00 |
5.408 times |
Mon 27 October 2025 |
896.25 (0.39%) |
892.75 |
885.20 - 898.90 |
0.1257 times |
Fri 24 October 2025 |
892.75 (-0.75%) |
898.05 |
887.00 - 898.05 |
0.0741 times |
Thu 23 October 2025 |
899.50 (2.15%) |
890.00 |
886.10 - 929.00 |
1.1145 times |
Tue 21 October 2025 |
880.60 (0.06%) |
881.80 |
875.60 - 888.30 |
0.0258 times |
Mon 20 October 2025 |
880.10 (0.92%) |
876.55 |
873.50 - 889.00 |
0.1477 times |
Fri 17 October 2025 |
872.05 (-0.63%) |
877.55 |
870.05 - 884.25 |
0.1104 times |
Thu 16 October 2025 |
877.55 (-1.07%) |
881.60 |
872.00 - 881.85 |
0.126 times |
Wed 15 October 2025 |
887.00 (4.4%) |
849.95 |
849.95 - 909.80 |
2.7448 times |
Tue 14 October 2025 |
849.65 (-1.89%) |
866.00 |
847.60 - 869.00 |
0.1231 times |
Mon 13 October 2025 |
866.00 (-0.68%) |
870.05 |
861.10 - 871.00 |
0.0955 times |
Weekly price and charts NewgenSoftware Strong weekly Stock price targets for NewgenSoftware NEWGEN are 940.88 and 1070.68 | Weekly Target 1 | 835.78 | | Weekly Target 2 | 916.17 | | Weekly Target 3 | 965.58333333333 | | Weekly Target 4 | 1045.97 | | Weekly Target 5 | 1095.38 |
Weekly price and volumes for Newgen Software
| Date |
Closing |
Open |
Range |
Volume |
Tue 28 October 2025 |
996.55 (11.63%) |
892.75 |
885.20 - 1015.00 |
1.9109 times |
Fri 24 October 2025 |
892.75 (2.37%) |
876.55 |
873.50 - 929.00 |
0.4703 times |
Fri 17 October 2025 |
872.05 (0.02%) |
870.05 |
847.60 - 909.80 |
1.105 times |
Fri 10 October 2025 |
871.90 (-2.21%) |
895.55 |
866.00 - 897.80 |
0.206 times |
Fri 03 October 2025 |
891.65 (0.34%) |
889.95 |
873.05 - 921.20 |
0.3361 times |
Fri 26 September 2025 |
888.60 (-2.94%) |
896.35 |
873.00 - 937.80 |
1.5193 times |
Fri 19 September 2025 |
915.50 (3.15%) |
887.50 |
880.75 - 947.00 |
1.5406 times |
Fri 12 September 2025 |
887.50 (0.08%) |
897.25 |
875.00 - 909.00 |
0.2649 times |
Fri 05 September 2025 |
886.75 (0.4%) |
887.00 |
881.05 - 925.90 |
0.3615 times |
Fri 29 August 2025 |
883.20 (1.93%) |
870.30 |
870.30 - 946.75 |
2.2853 times |
Fri 22 August 2025 |
866.45 (-2.26%) |
886.85 |
863.70 - 897.95 |
0.3746 times |

Monthly price and charts NewgenSoftware Strong monthly Stock price targets for NewgenSoftware NEWGEN are 922.08 and 1089.48 | Monthly Target 1 | 785.65 | | Monthly Target 2 | 891.1 | | Monthly Target 3 | 953.05 | | Monthly Target 4 | 1058.5 | | Monthly Target 5 | 1120.45 |
Monthly price and volumes Newgen Software
| Date |
Closing |
Open |
Range |
Volume |
Tue 28 October 2025 |
996.55 (12.01%) |
896.55 |
847.60 - 1015.00 |
0.9298 times |
Tue 30 September 2025 |
889.70 (0.74%) |
887.00 |
873.00 - 947.00 |
0.8883 times |
Fri 29 August 2025 |
883.20 (4.04%) |
848.90 |
815.00 - 977.00 |
2.4761 times |
Thu 31 July 2025 |
848.90 (-27.56%) |
1172.10 |
829.90 - 1175.90 |
0.522 times |
Mon 30 June 2025 |
1171.80 (-5.28%) |
1237.10 |
1115.00 - 1336.00 |
0.8133 times |
Fri 30 May 2025 |
1237.10 (25.4%) |
988.55 |
967.25 - 1377.15 |
1.7072 times |
Wed 30 April 2025 |
986.55 (-0.98%) |
1010.00 |
758.20 - 1183.40 |
1.0201 times |
Fri 28 March 2025 |
996.30 (6.41%) |
932.00 |
915.10 - 1094.85 |
0.4082 times |
Fri 28 February 2025 |
936.25 (-10.68%) |
1070.00 |
910.70 - 1176.00 |
0.3118 times |
Fri 31 January 2025 |
1048.15 (-38.41%) |
1725.00 |
951.45 - 1798.90 |
0.9234 times |
Tue 31 December 2024 |
1701.80 (44.16%) |
1175.05 |
1150.55 - 1755.00 |
0.5834 times |

DMA SMA EMA moving averages of Newgen Software NEWGEN
DMA (daily moving average) of Newgen Software NEWGEN
| DMA period | DMA value | | 5 day DMA | 913.13 | | 12 day DMA | 889.16 | | 20 day DMA | 887.03 | | 35 day DMA | 888.77 | | 50 day DMA | 888.92 | | 100 day DMA | 969.51 | | 150 day DMA | 1003.2 | | 200 day DMA | 1037.34 | EMA (exponential moving average) of Newgen Software NEWGEN
| EMA period | EMA current | EMA prev | EMA prev2 | | 5 day EMA | 925.75 | 890.35 | 887.4 | | 12 day EMA | 902.03 | 884.85 | 882.78 | | 20 day EMA | 894.68 | 883.96 | 882.67 | | 35 day EMA | 890.08 | 883.81 | 883.08 | | 50 day EMA | 890.28 | 885.94 | 885.52 |
SMA (simple moving average) of Newgen Software NEWGEN
| SMA period | SMA current | SMA prev | SMA prev2 | | 5 day SMA | 913.13 | 889.84 | 885 | | 12 day SMA | 889.16 | 878.83 | 877 | | 20 day SMA | 887.03 | 881.64 | 882.3 | | 35 day SMA | 888.77 | 885.64 | 885.72 | | 50 day SMA | 888.92 | 886.08 | 885.39 | | 100 day SMA | 969.51 | 971.79 | 975.04 | | 150 day SMA | 1003.2 | 1002.68 | 1002.94 | | 200 day SMA | 1037.34 | 1040.57 | 1044.54 |
|
|
