TataamlNetf NETF full analysis,charts,indicators,moving averages,SMA,DMA,EMA,ADX,MACD,RSITataaml Netf NETF WideScreen charts, DMA,SMA,EMA technical analysis, forecast prediction, by indicators ADX,MACD,RSI,CCI NSE stock exchange
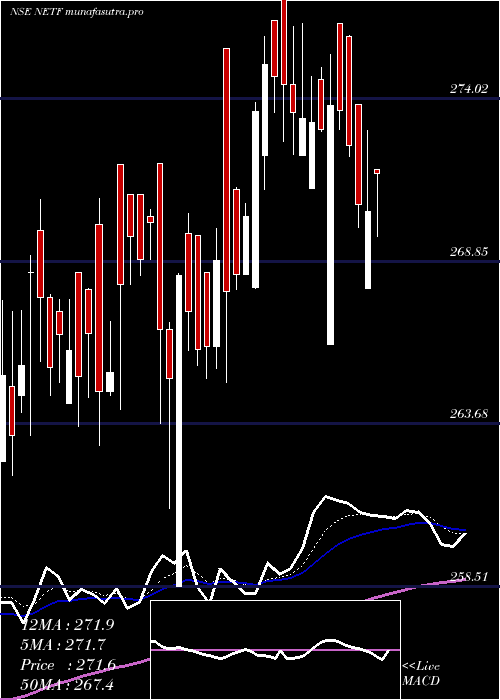
Daily price and charts and targets TataamlNetf Strong Daily Stock price targets for TataamlNetf NETF are 277.65 and 280.43 | Daily Target 1 | 277.05 | | Daily Target 2 | 278.25 | | Daily Target 3 | 279.83 | | Daily Target 4 | 281.03 | | Daily Target 5 | 282.61 |
Daily price and volume Tataaml Netf
| Date |
Closing |
Open |
Range |
Volume |
Thu 30 October 2025 |
279.45 (-0.55%) |
280.99 |
278.63 - 281.41 |
1.17 times |
Wed 29 October 2025 |
281.00 (0.46%) |
281.99 |
278.55 - 282.00 |
0.3831 times |
Tue 28 October 2025 |
279.70 (0.02%) |
281.04 |
277.56 - 281.04 |
0.7359 times |
Mon 27 October 2025 |
279.65 (0.58%) |
276.90 |
276.89 - 280.50 |
1.856 times |
Fri 24 October 2025 |
278.03 (-0.55%) |
282.97 |
277.15 - 282.98 |
0.384 times |
Thu 23 October 2025 |
279.58 (-0.15%) |
280.01 |
278.82 - 284.38 |
1.1782 times |
Tue 21 October 2025 |
279.99 (0.54%) |
278.50 |
276.72 - 285.70 |
0.8397 times |
Mon 20 October 2025 |
278.50 (0.38%) |
279.99 |
277.45 - 280.00 |
0.8552 times |
Fri 17 October 2025 |
277.44 (0.79%) |
275.26 |
274.94 - 277.75 |
1.7941 times |
Thu 16 October 2025 |
275.27 (0.68%) |
273.43 |
272.68 - 275.98 |
0.8039 times |
Wed 15 October 2025 |
273.42 (0.49%) |
272.09 |
272.09 - 275.00 |
0.3069 times |
Weekly price and charts TataamlNetf Strong weekly Stock price targets for TataamlNetf NETF are 278.17 and 283.28 | Weekly Target 1 | 274.34 | | Weekly Target 2 | 276.89 | | Weekly Target 3 | 279.44666666667 | | Weekly Target 4 | 282 | | Weekly Target 5 | 284.56 |
Weekly price and volumes for Tataaml Netf
| Date |
Closing |
Open |
Range |
Volume |
Thu 30 October 2025 |
279.45 (0.51%) |
276.90 |
276.89 - 282.00 |
1.0544 times |
Fri 24 October 2025 |
278.03 (0.21%) |
279.99 |
276.72 - 285.70 |
0.8285 times |
Fri 17 October 2025 |
277.44 (1.97%) |
274.89 |
268.10 - 278.24 |
1.105 times |
Fri 10 October 2025 |
272.08 (0.38%) |
271.47 |
268.56 - 273.97 |
1.2137 times |
Fri 03 October 2025 |
271.05 (2.04%) |
258.98 |
258.98 - 278.13 |
1.6744 times |
Fri 26 September 2025 |
265.63 (-2.57%) |
273.99 |
262.97 - 273.99 |
1.3296 times |
Fri 19 September 2025 |
272.65 (0.84%) |
272.39 |
268.75 - 275.00 |
0.6633 times |
Fri 12 September 2025 |
270.39 (1.41%) |
265.00 |
265.00 - 271.23 |
0.611 times |
Fri 05 September 2025 |
266.62 (0.97%) |
266.49 |
263.10 - 268.63 |
0.5685 times |
Fri 29 August 2025 |
264.07 (-1.99%) |
269.44 |
263.30 - 272.45 |
0.9516 times |
Fri 22 August 2025 |
269.43 (1.44%) |
266.00 |
266.00 - 272.19 |
0.485 times |
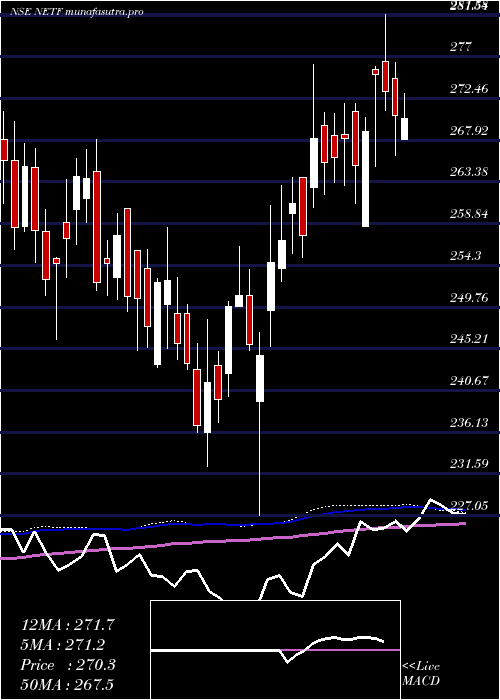
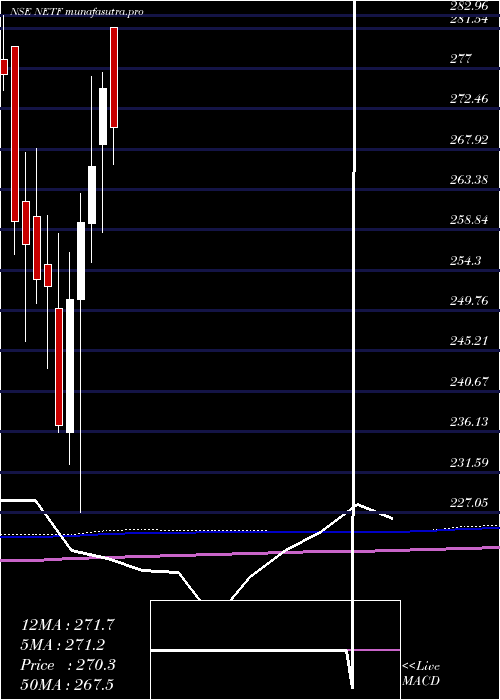
Monthly price and charts TataamlNetf Strong monthly Stock price targets for TataamlNetf NETF are 272.91 and 292.24 | Monthly Target 1 | 257.84 | | Monthly Target 2 | 268.65 | | Monthly Target 3 | 277.17333333333 | | Monthly Target 4 | 287.98 | | Monthly Target 5 | 296.5 |
Monthly price and volumes Tataaml Netf
| Date |
Closing |
Open |
Range |
Volume |
Thu 30 October 2025 |
279.45 (2.06%) |
271.97 |
266.37 - 285.70 |
0.9097 times |
Tue 30 September 2025 |
273.82 (3.69%) |
266.49 |
258.98 - 278.13 |
0.5914 times |
Fri 29 August 2025 |
264.07 (-1.05%) |
266.77 |
262.34 - 273.63 |
0.5093 times |
Thu 31 July 2025 |
266.86 (-2.86%) |
281.58 |
261.31 - 281.58 |
0.4445 times |
Mon 30 June 2025 |
274.72 (3.28%) |
268.50 |
258.51 - 276.50 |
1.0597 times |
Fri 30 May 2025 |
265.99 (2.42%) |
259.51 |
255.18 - 276.13 |
2.0759 times |
Wed 30 April 2025 |
259.71 (3.45%) |
251.04 |
227.05 - 262.99 |
1.2651 times |
Fri 28 March 2025 |
251.04 (6%) |
236.08 |
232.45 - 256.31 |
1.6707 times |
Fri 28 February 2025 |
236.83 (-6.18%) |
250.00 |
236.08 - 258.46 |
0.6215 times |
Fri 31 January 2025 |
252.44 (-0.32%) |
254.99 |
243.17 - 260.49 |
0.8523 times |
Tue 31 December 2024 |
253.24 (-1.53%) |
260.40 |
250.55 - 268.00 |
0.8984 times |
DMA SMA EMA moving averages of Tataaml Netf NETF
DMA (daily moving average) of Tataaml Netf NETF
| DMA period | DMA value | | 5 day DMA | 279.57 | | 12 day DMA | 277.84 | | 20 day DMA | 275.12 | | 35 day DMA | 273.1 | | 50 day DMA | 271.36 | | 100 day DMA | 270.22 | | 150 day DMA | 266.33 | | 200 day DMA | 261.29 | EMA (exponential moving average) of Tataaml Netf NETF
| EMA period | EMA current | EMA prev | EMA prev2 | | 5 day EMA | 279.57 | 279.63 | 278.95 | | 12 day EMA | 277.83 | 277.53 | 276.9 | | 20 day EMA | 276.09 | 275.74 | 275.19 | | 35 day EMA | 273.8 | 273.47 | 273.03 | | 50 day EMA | 271.74 | 271.43 | 271.04 |
SMA (simple moving average) of Tataaml Netf NETF
| SMA period | SMA current | SMA prev | SMA prev2 | | 5 day SMA | 279.57 | 279.59 | 279.39 | | 12 day SMA | 277.84 | 277.18 | 276.43 | | 20 day SMA | 275.12 | 274.84 | 274.11 | | 35 day SMA | 273.1 | 272.77 | 272.38 | | 50 day SMA | 271.36 | 271.16 | 270.85 | | 100 day SMA | 270.22 | 270.11 | 269.95 | | 150 day SMA | 266.33 | 266.13 | 265.9 | | 200 day SMA | 261.29 | 261.16 | 261.02 |
|
|
