Nelcast NELCAST full analysis,charts,indicators,moving averages,SMA,DMA,EMA,ADX,MACD,RSINelcast NELCAST WideScreen charts, DMA,SMA,EMA technical analysis, forecast prediction, by indicators ADX,MACD,RSI,CCI NSE stock exchange
operates under Other Industrial Products sector
Daily price and charts and targets Nelcast Strong Daily Stock price targets for Nelcast NELCAST are 125.97 and 131.57 | Daily Target 1 | 121.58 | | Daily Target 2 | 124.75 | | Daily Target 3 | 127.17666666667 | | Daily Target 4 | 130.35 | | Daily Target 5 | 132.78 |
Daily price and volume Nelcast
| Date |
Closing |
Open |
Range |
Volume |
Tue 28 October 2025 |
127.93 (2.78%) |
124.00 |
124.00 - 129.60 |
0.8528 times |
Mon 27 October 2025 |
124.47 (3.97%) |
121.85 |
120.54 - 130.50 |
2.0836 times |
Fri 24 October 2025 |
119.72 (0.24%) |
119.43 |
118.60 - 121.88 |
0.3069 times |
Thu 23 October 2025 |
119.43 (0.44%) |
119.00 |
119.00 - 121.72 |
0.4405 times |
Tue 21 October 2025 |
118.91 (-0.49%) |
119.76 |
118.00 - 121.40 |
0.1028 times |
Mon 20 October 2025 |
119.50 (1.07%) |
119.47 |
116.27 - 121.89 |
0.6559 times |
Fri 17 October 2025 |
118.24 (-4.75%) |
125.65 |
116.00 - 125.65 |
1.4758 times |
Thu 16 October 2025 |
124.13 (15.59%) |
108.00 |
107.75 - 128.86 |
3.2304 times |
Wed 15 October 2025 |
107.39 (-2.19%) |
110.99 |
106.15 - 111.06 |
0.4619 times |
Tue 14 October 2025 |
109.79 (-0.02%) |
111.70 |
109.00 - 112.91 |
0.3894 times |
Mon 13 October 2025 |
109.81 (-3.29%) |
113.00 |
108.61 - 114.79 |
0.4909 times |

Weekly price and charts Nelcast Strong weekly Stock price targets for Nelcast NELCAST are 124.24 and 134.2 | Weekly Target 1 | 116.36 | | Weekly Target 2 | 122.15 | | Weekly Target 3 | 126.32333333333 | | Weekly Target 4 | 132.11 | | Weekly Target 5 | 136.28 |
Weekly price and volumes for Nelcast
| Date |
Closing |
Open |
Range |
Volume |
Tue 28 October 2025 |
127.93 (6.86%) |
121.85 |
120.54 - 130.50 |
1.1441 times |
Fri 24 October 2025 |
119.72 (1.25%) |
119.47 |
116.27 - 121.89 |
0.5868 times |
Fri 17 October 2025 |
118.24 (4.13%) |
113.00 |
106.15 - 128.86 |
2.3567 times |
Fri 10 October 2025 |
113.55 (-11.6%) |
128.45 |
110.00 - 130.09 |
1.4919 times |
Fri 03 October 2025 |
128.45 (-7.12%) |
136.12 |
124.01 - 137.41 |
0.8402 times |
Fri 26 September 2025 |
138.30 (-5.12%) |
147.65 |
136.12 - 147.65 |
0.78 times |
Fri 19 September 2025 |
145.77 (-0.88%) |
149.60 |
144.30 - 149.60 |
0.5306 times |
Fri 12 September 2025 |
147.07 (0.83%) |
146.49 |
142.20 - 148.93 |
0.5825 times |
Fri 05 September 2025 |
145.86 (-0.78%) |
149.80 |
144.99 - 154.40 |
0.7101 times |
Fri 29 August 2025 |
147.01 (-10.29%) |
165.18 |
142.61 - 167.39 |
0.977 times |
Fri 22 August 2025 |
163.87 (1.8%) |
163.00 |
159.06 - 169.99 |
1.3632 times |
Monthly price and charts Nelcast Strong monthly Stock price targets for Nelcast NELCAST are 117.04 and 141.39 | Monthly Target 1 | 97.18 | | Monthly Target 2 | 112.55 | | Monthly Target 3 | 121.52666666667 | | Monthly Target 4 | 136.9 | | Monthly Target 5 | 145.88 |
Monthly price and volumes Nelcast
| Date |
Closing |
Open |
Range |
Volume |
Tue 28 October 2025 |
127.93 (2.11%) |
127.00 |
106.15 - 130.50 |
0.6671 times |
Tue 30 September 2025 |
125.29 (-14.77%) |
149.80 |
124.01 - 154.40 |
0.3638 times |
Fri 29 August 2025 |
147.01 (-6.41%) |
160.89 |
142.61 - 180.90 |
4.1128 times |
Thu 31 July 2025 |
157.08 (5.82%) |
149.50 |
135.55 - 170.99 |
1.4688 times |
Mon 30 June 2025 |
148.44 (8.58%) |
133.10 |
125.66 - 154.75 |
1.4247 times |
Fri 30 May 2025 |
136.71 (57.35%) |
86.70 |
81.02 - 144.00 |
0.7245 times |
Wed 30 April 2025 |
86.88 (4.69%) |
83.99 |
80.60 - 98.50 |
0.1881 times |
Fri 28 March 2025 |
82.99 (-13.06%) |
97.00 |
78.55 - 97.59 |
0.6471 times |
Fri 28 February 2025 |
95.46 (-10.28%) |
105.00 |
95.00 - 112.05 |
0.182 times |
Fri 31 January 2025 |
106.40 (-13.96%) |
124.00 |
96.77 - 129.30 |
0.221 times |
Tue 31 December 2024 |
123.67 (5.5%) |
117.22 |
115.72 - 134.00 |
0.2298 times |
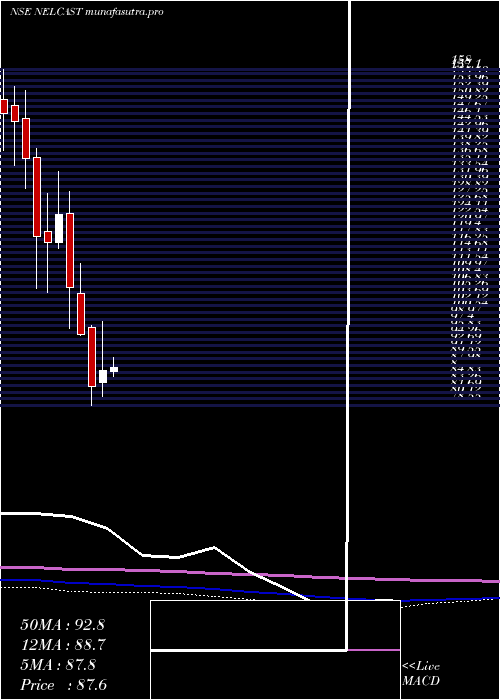
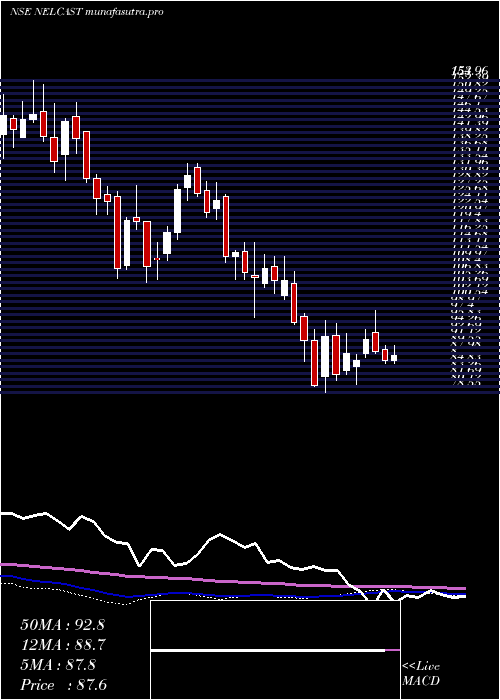
DMA SMA EMA moving averages of Nelcast NELCAST
DMA (daily moving average) of Nelcast NELCAST
| DMA period | DMA value | | 5 day DMA | 122.09 | | 12 day DMA | 117.74 | | 20 day DMA | 120.23 | | 35 day DMA | 130.86 | | 50 day DMA | 138.45 | | 100 day DMA | 143.86 | | 150 day DMA | 129.77 | | 200 day DMA | 123.11 | EMA (exponential moving average) of Nelcast NELCAST
| EMA period | EMA current | EMA prev | EMA prev2 | | 5 day EMA | 123.14 | 120.75 | 118.89 | | 12 day EMA | 121.48 | 120.31 | 119.55 | | 20 day EMA | 123.84 | 123.41 | 123.3 | | 35 day EMA | 130.65 | 130.81 | 131.18 | | 50 day EMA | 139.48 | 139.95 | 140.58 |
SMA (simple moving average) of Nelcast NELCAST
| SMA period | SMA current | SMA prev | SMA prev2 | | 5 day SMA | 122.09 | 120.41 | 119.16 | | 12 day SMA | 117.74 | 116.33 | 116.05 | | 20 day SMA | 120.23 | 120.75 | 121.73 | | 35 day SMA | 130.86 | 131.37 | 132.03 | | 50 day SMA | 138.45 | 139.26 | 140.11 | | 100 day SMA | 143.86 | 143.88 | 143.93 | | 150 day SMA | 129.77 | 129.53 | 129.24 | | 200 day SMA | 123.11 | 123.06 | 123.06 |
|
|
