NectarLifesciences NECLIFE_BE full analysis,charts,indicators,moving averages,SMA,DMA,EMA,ADX,MACD,RSINectar Lifesciences NECLIFE_BE WideScreen charts, DMA,SMA,EMA technical analysis, forecast prediction, by indicators ADX,MACD,RSI,CCI NSE stock exchange
Daily price and charts and targets NectarLifesciences Strong Daily Stock price targets for NectarLifesciences NECLIFE_BE are 15.76 and 15.76 | Daily Target 1 | 15.76 | | Daily Target 2 | 15.76 | | Daily Target 3 | 15.76 | | Daily Target 4 | 15.76 | | Daily Target 5 | 15.76 |
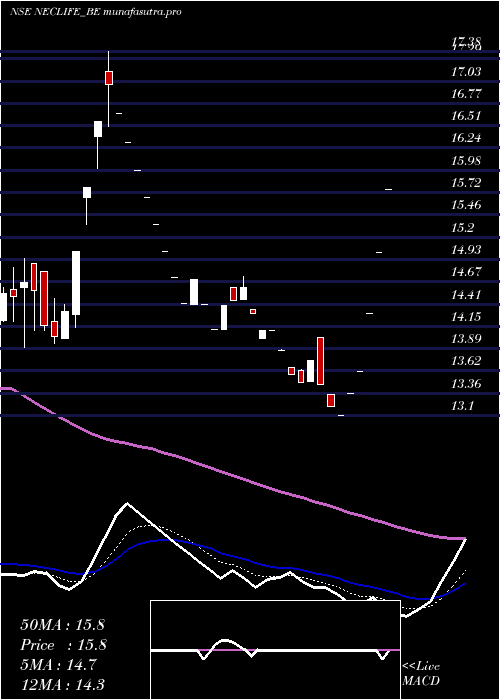
Daily price and volume Nectar Lifesciences
| Date |
Closing |
Open |
Range |
Volume |
Wed 29 October 2025 |
15.76 (5%) |
15.76 |
15.76 - 15.76 |
0.711 times |
Tue 28 October 2025 |
15.01 (4.97%) |
15.01 |
15.01 - 15.01 |
0.3864 times |
Mon 27 October 2025 |
14.30 (4.99%) |
14.30 |
14.30 - 14.30 |
0.8962 times |
Fri 24 October 2025 |
13.62 (1.95%) |
13.62 |
13.62 - 13.62 |
0.2105 times |
Thu 23 October 2025 |
13.36 (1.98%) |
13.36 |
13.36 - 13.36 |
1.7124 times |
Tue 21 October 2025 |
13.10 (-0.76%) |
13.10 |
13.10 - 13.10 |
0.2265 times |
Mon 20 October 2025 |
13.20 (-2%) |
13.35 |
13.20 - 13.35 |
2.1201 times |
Fri 17 October 2025 |
13.47 (-2.04%) |
14.02 |
13.47 - 14.02 |
1.6608 times |
Thu 16 October 2025 |
13.75 (1.93%) |
13.50 |
13.50 - 13.75 |
0.9061 times |
Wed 15 October 2025 |
13.49 (-0.66%) |
13.63 |
13.49 - 13.64 |
1.1699 times |
Tue 14 October 2025 |
13.58 (-2.02%) |
13.66 |
13.58 - 13.66 |
1.0121 times |
Weekly price and charts NectarLifesciences Strong weekly Stock price targets for NectarLifesciences NECLIFE_BE are 15.03 and 16.49 | Weekly Target 1 | 13.81 | | Weekly Target 2 | 14.79 | | Weekly Target 3 | 15.273333333333 | | Weekly Target 4 | 16.25 | | Weekly Target 5 | 16.73 |
Weekly price and volumes for Nectar Lifesciences
| Date |
Closing |
Open |
Range |
Volume |
Wed 29 October 2025 |
15.76 (15.71%) |
14.30 |
14.30 - 15.76 |
0.2952 times |
Fri 24 October 2025 |
13.62 (1.11%) |
13.35 |
13.10 - 13.62 |
0.6322 times |
Fri 17 October 2025 |
13.47 (-4.47%) |
13.86 |
13.47 - 14.02 |
0.8436 times |
Fri 10 October 2025 |
14.10 (-2.02%) |
14.60 |
14.01 - 14.73 |
0.6175 times |
Fri 03 October 2025 |
14.39 (-0.21%) |
14.40 |
14.11 - 14.70 |
1.0225 times |
Fri 26 September 2025 |
14.42 (-9.76%) |
15.66 |
14.42 - 15.66 |
0.2715 times |
Fri 19 September 2025 |
15.98 (1.27%) |
16.38 |
15.98 - 17.38 |
2.1523 times |
Fri 12 September 2025 |
15.78 (8.3%) |
14.79 |
13.95 - 15.78 |
2.145 times |
Fri 05 September 2025 |
14.57 (2.1%) |
14.30 |
13.90 - 14.95 |
1.4043 times |
Fri 29 August 2025 |
14.27 (-10.08%) |
15.79 |
14.16 - 15.79 |
0.6159 times |
Fri 22 August 2025 |
15.87 (9.3%) |
14.20 |
14.20 - 16.00 |
1.623 times |
Monthly price and charts NectarLifesciences Strong monthly Stock price targets for NectarLifesciences NECLIFE_BE are 14.43 and 17.09 | Monthly Target 1 | 12.21 | | Monthly Target 2 | 13.99 | | Monthly Target 3 | 14.873333333333 | | Monthly Target 4 | 16.65 | | Monthly Target 5 | 17.53 |
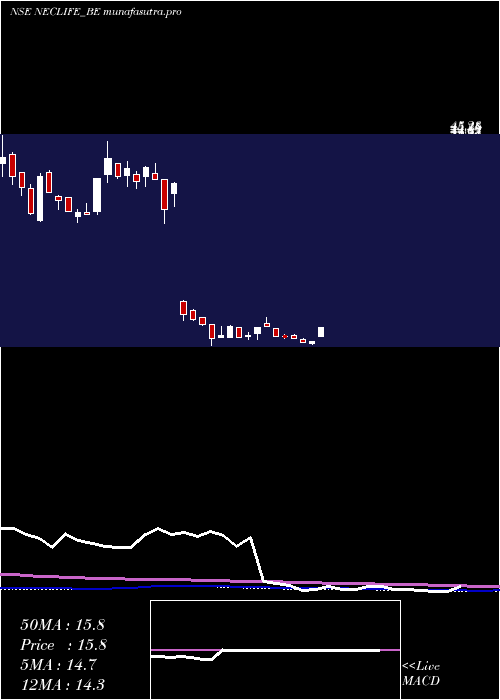
Monthly price and volumes Nectar Lifesciences
| Date |
Closing |
Open |
Range |
Volume |
Wed 29 October 2025 |
15.76 (9.44%) |
14.11 |
13.10 - 15.76 |
0.1605 times |
Tue 30 September 2025 |
14.40 (0.91%) |
14.30 |
13.90 - 17.38 |
0.3981 times |
Fri 29 August 2025 |
14.27 (-13.04%) |
16.41 |
13.05 - 16.90 |
0.435 times |
Thu 31 July 2025 |
16.41 (-56.75%) |
19.80 |
16.03 - 19.99 |
0.6905 times |
Fri 07 February 2025 |
37.94 (11.88%) |
36.45 |
34.45 - 38.05 |
0.3025 times |
Fri 31 January 2025 |
33.91 (-13.01%) |
39.75 |
31.81 - 41.35 |
1.1227 times |
Tue 31 December 2024 |
38.98 (16.18%) |
33.50 |
33.12 - 44.41 |
4.2699 times |
Fri 29 November 2024 |
33.55 (-11.01%) |
38.00 |
31.87 - 40.00 |
0.9666 times |
Thu 31 October 2024 |
37.70 (-6.98%) |
40.00 |
32.10 - 45.28 |
1.0583 times |
Mon 30 September 2024 |
40.53 (0%) |
40.60 |
39.40 - 42.69 |
0.5959 times |
Wed 29 October 2025 |
(0%) |
|
- |
0 times |

DMA SMA EMA moving averages of Nectar Lifesciences NECLIFE_BE
DMA (daily moving average) of Nectar Lifesciences NECLIFE_BE
| DMA period | DMA value | | 5 day DMA | 14.41 | | 12 day DMA | 13.88 | | 20 day DMA | 14.05 | | 35 day DMA | 14.64 | | 50 day DMA | 14.7 | | 100 day DMA | 21.08 | | 150 day DMA | 26.25 | | 200 day DMA | | EMA (exponential moving average) of Nectar Lifesciences NECLIFE_BE
| EMA period | EMA current | EMA prev | EMA prev2 | | 5 day EMA | 14.69 | 14.16 | 13.73 | | 12 day EMA | 14.25 | 13.97 | 13.78 | | 20 day EMA | 14.26 | 14.1 | 14 | | 35 day EMA | 14.38 | 14.3 | 14.26 | | 50 day EMA | 14.69 | 14.65 | 14.64 |
SMA (simple moving average) of Nectar Lifesciences NECLIFE_BE
| SMA period | SMA current | SMA prev | SMA prev2 | | 5 day SMA | 14.41 | 13.88 | 13.52 | | 12 day SMA | 13.88 | 13.74 | 13.66 | | 20 day SMA | 14.05 | 13.99 | 13.97 | | 35 day SMA | 14.64 | 14.6 | 14.58 | | 50 day SMA | 14.7 | 14.67 | 14.68 | | 100 day SMA | 21.08 | 21.33 | 21.58 | | 150 day SMA | 26.25 | 26.39 | 26.54 | | 200 day SMA |
|
|
