NdlVentures NDLVENTURE full analysis,charts,indicators,moving averages,SMA,DMA,EMA,ADX,MACD,RSINdl Ventures NDLVENTURE WideScreen charts, DMA,SMA,EMA technical analysis, forecast prediction, by indicators ADX,MACD,RSI,CCI NSE stock exchange
Daily price and charts and targets NdlVentures Strong Daily Stock price targets for NdlVentures NDLVENTURE are 87.54 and 91.16 | Daily Target 1 | 86.83 | | Daily Target 2 | 88.25 | | Daily Target 3 | 90.453333333333 | | Daily Target 4 | 91.87 | | Daily Target 5 | 94.07 |
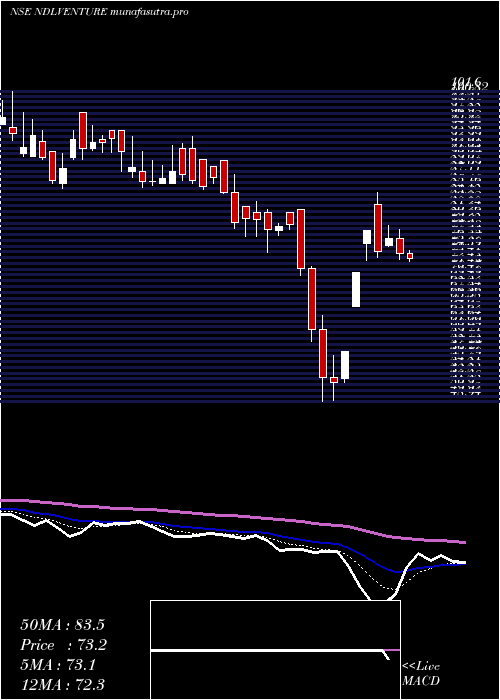
Daily price and volume Ndl Ventures
| Date |
Closing |
Open |
Range |
Volume |
Wed 10 December 2025 |
89.66 (0.16%) |
90.26 |
89.04 - 92.66 |
0.0412 times |
Tue 09 December 2025 |
89.52 (-3.72%) |
91.10 |
86.30 - 96.90 |
0.1292 times |
Mon 08 December 2025 |
92.98 (-3.83%) |
94.00 |
91.00 - 96.17 |
0.0267 times |
Fri 05 December 2025 |
96.68 (1.89%) |
94.99 |
92.10 - 97.87 |
0.0267 times |
Thu 04 December 2025 |
94.89 (-2.02%) |
98.90 |
94.00 - 98.90 |
0.0374 times |
Wed 03 December 2025 |
96.85 (-0.53%) |
97.36 |
95.40 - 98.40 |
0.0138 times |
Tue 02 December 2025 |
97.37 (6.06%) |
97.93 |
95.01 - 98.87 |
0.0268 times |
Mon 18 August 2025 |
91.81 (-8.13%) |
99.61 |
89.93 - 99.61 |
0.4993 times |
Thu 14 August 2025 |
99.93 (-2.1%) |
107.74 |
92.20 - 112.25 |
3.1284 times |
Wed 13 August 2025 |
102.07 (20%) |
96.99 |
93.25 - 102.07 |
6.0705 times |
Tue 12 August 2025 |
85.06 (19.99%) |
79.00 |
79.00 - 85.06 |
0.8475 times |
Weekly price and charts NdlVentures Strong weekly Stock price targets for NdlVentures NDLVENTURE are 82.68 and 93.28 | Weekly Target 1 | 80.35 | | Weekly Target 2 | 85.01 | | Weekly Target 3 | 90.953333333333 | | Weekly Target 4 | 95.61 | | Weekly Target 5 | 101.55 |
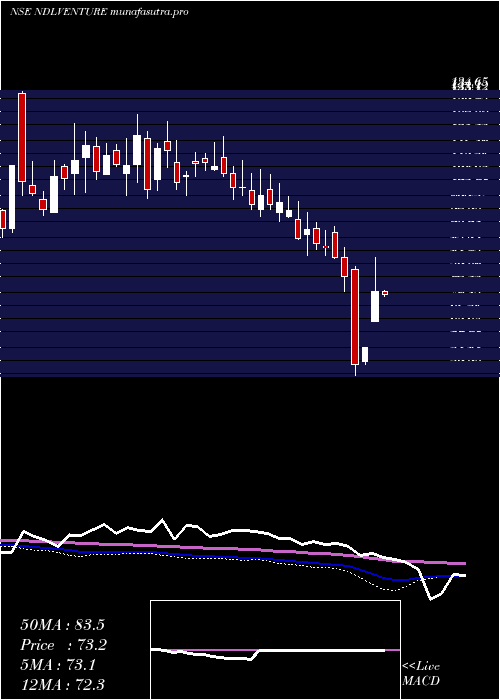
Weekly price and volumes for Ndl Ventures
| Date |
Closing |
Open |
Range |
Volume |
Wed 10 December 2025 |
89.66 (-7.26%) |
94.00 |
86.30 - 96.90 |
0.1189 times |
Fri 05 December 2025 |
96.68 (-3.25%) |
99.61 |
89.93 - 99.61 |
0.3642 times |
Thu 14 August 2025 |
99.93 (57.52%) |
64.10 |
62.41 - 112.25 |
6.1384 times |
Fri 08 August 2025 |
63.44 (-3.38%) |
66.10 |
62.21 - 70.67 |
0.2123 times |
Fri 01 August 2025 |
65.66 (-2.44%) |
70.90 |
63.10 - 71.00 |
0.1537 times |
Fri 25 July 2025 |
67.30 (-4.36%) |
71.00 |
65.37 - 75.85 |
0.1653 times |
Fri 18 July 2025 |
70.37 (-5.07%) |
74.13 |
67.64 - 75.98 |
0.1282 times |
Fri 11 July 2025 |
74.13 (29.1%) |
65.11 |
65.10 - 84.50 |
0.6489 times |
Tue 01 April 2025 |
57.42 (10%) |
53.00 |
52.23 - 57.42 |
0.0866 times |
Fri 28 March 2025 |
52.20 (-33.69%) |
81.00 |
48.94 - 81.65 |
1.9835 times |
Fri 21 March 2025 |
78.72 (-6.74%) |
84.41 |
74.35 - 87.60 |
0.4392 times |
Monthly price and charts NdlVentures Strong monthly Stock price targets for NdlVentures NDLVENTURE are 81.68 and 94.28 | Monthly Target 1 | 79.02 | | Monthly Target 2 | 84.34 | | Monthly Target 3 | 91.62 | | Monthly Target 4 | 96.94 | | Monthly Target 5 | 104.22 |
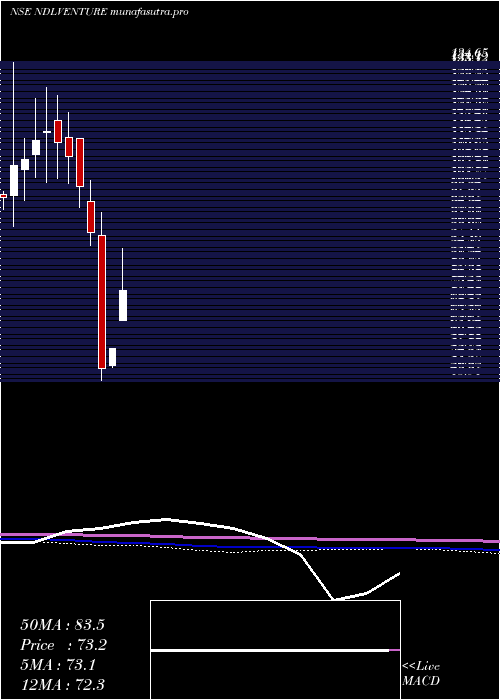
Monthly price and volumes Ndl Ventures
| Date |
Closing |
Open |
Range |
Volume |
Wed 10 December 2025 |
89.66 (-2.34%) |
97.93 |
86.30 - 98.90 |
0.1193 times |
Mon 18 August 2025 |
91.81 (42.27%) |
64.50 |
62.21 - 112.25 |
4.3675 times |
Thu 31 July 2025 |
64.53 (12.38%) |
65.11 |
63.10 - 84.50 |
0.712 times |
Tue 01 April 2025 |
57.42 (10%) |
53.00 |
52.23 - 57.42 |
0.0568 times |
Fri 28 March 2025 |
52.20 (-41.18%) |
87.98 |
48.94 - 94.00 |
1.6778 times |
Fri 28 February 2025 |
88.74 (-12.24%) |
97.01 |
85.10 - 102.85 |
0.1764 times |
Fri 31 January 2025 |
101.12 (-7.37%) |
113.99 |
95.40 - 113.99 |
0.3804 times |
Tue 31 December 2024 |
109.17 (-3.31%) |
114.41 |
102.00 - 121.18 |
0.3657 times |
Fri 29 November 2024 |
112.91 (-2.53%) |
118.90 |
103.30 - 125.70 |
0.5261 times |
Thu 31 October 2024 |
115.84 (1.95%) |
115.70 |
102.32 - 127.70 |
1.6181 times |
Mon 30 September 2024 |
113.62 (4.76%) |
109.80 |
103.61 - 124.98 |
3.8911 times |
DMA SMA EMA moving averages of Ndl Ventures NDLVENTURE
DMA (daily moving average) of Ndl Ventures NDLVENTURE
| DMA period | DMA value | | 5 day DMA | 92.75 | | 12 day DMA | 92.31 | | 20 day DMA | 81.49 | | 35 day DMA | 77.06 | | 50 day DMA | 75.77 | | 100 day DMA | 86.49 | | 150 day DMA | 94.99 | | 200 day DMA | 98.78 | EMA (exponential moving average) of Ndl Ventures NDLVENTURE
| EMA period | EMA current | EMA prev | EMA prev2 | | 5 day EMA | 91.69 | 92.71 | 94.31 | | 12 day EMA | 89.19 | 89.11 | 89.03 | | 20 day EMA | 85.29 | 84.83 | 84.34 | | 35 day EMA | 81.65 | 81.18 | 80.69 | | 50 day EMA | 78.34 | 77.88 | 77.4 |
SMA (simple moving average) of Ndl Ventures NDLVENTURE
| SMA period | SMA current | SMA prev | SMA prev2 | | 5 day SMA | 92.75 | 94.18 | 95.75 | | 12 day SMA | 92.31 | 90.12 | 88.12 | | 20 day SMA | 81.49 | 80.44 | 79.17 | | 35 day SMA | 77.06 | 76.73 | 76.19 | | 50 day SMA | 75.77 | 75.68 | 75.62 | | 100 day SMA | 86.49 | 86.65 | 86.81 | | 150 day SMA | 94.99 | 95.15 | 95.3 | | 200 day SMA | 98.78 | 98.86 | 98.95 |
|
|
