NandanDenim NDL full analysis,charts,indicators,moving averages,SMA,DMA,EMA,ADX,MACD,RSINandan Denim NDL WideScreen charts, DMA,SMA,EMA technical analysis, forecast prediction, by indicators ADX,MACD,RSI,CCI NSE stock exchange
operates under Textiles sector
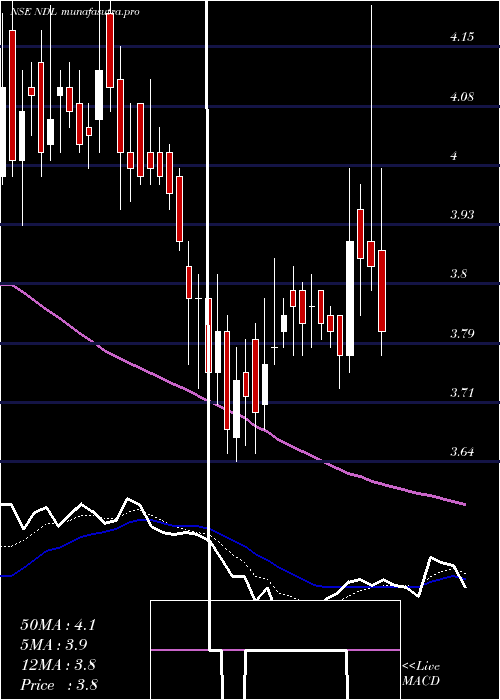
Daily price and charts and targets NandanDenim Strong Daily Stock price targets for NandanDenim NDL are 3.29 and 3.38 | Daily Target 1 | 3.27 | | Daily Target 2 | 3.3 | | Daily Target 3 | 3.3566666666667 | | Daily Target 4 | 3.39 | | Daily Target 5 | 3.45 |
Daily price and volume Nandan Denim
| Date |
Closing |
Open |
Range |
Volume |
Tue 28 October 2025 |
3.34 (-0.6%) |
3.39 |
3.32 - 3.41 |
0.9667 times |
Mon 27 October 2025 |
3.36 (-0.59%) |
3.40 |
3.36 - 3.46 |
1.0688 times |
Fri 24 October 2025 |
3.38 (0.3%) |
3.40 |
3.35 - 3.43 |
1.178 times |
Thu 23 October 2025 |
3.37 (2.74%) |
3.29 |
3.24 - 3.48 |
2.0547 times |
Tue 21 October 2025 |
3.28 (3.8%) |
3.16 |
3.16 - 3.31 |
0.6631 times |
Mon 20 October 2025 |
3.16 (0%) |
3.17 |
3.14 - 3.21 |
0.6959 times |
Fri 17 October 2025 |
3.16 (-0.32%) |
3.16 |
3.14 - 3.19 |
0.6448 times |
Thu 16 October 2025 |
3.17 (0.96%) |
3.16 |
3.14 - 3.23 |
0.9346 times |
Wed 15 October 2025 |
3.14 (-0.95%) |
3.15 |
3.11 - 3.19 |
0.9031 times |
Tue 14 October 2025 |
3.17 (-0.94%) |
3.20 |
3.14 - 3.20 |
0.8903 times |
Mon 13 October 2025 |
3.20 (-0.62%) |
3.25 |
3.18 - 3.25 |
0.7117 times |
Weekly price and charts NandanDenim Strong weekly Stock price targets for NandanDenim NDL are 3.26 and 3.4 | Weekly Target 1 | 3.23 | | Weekly Target 2 | 3.29 | | Weekly Target 3 | 3.3733333333333 | | Weekly Target 4 | 3.43 | | Weekly Target 5 | 3.51 |
Weekly price and volumes for Nandan Denim
| Date |
Closing |
Open |
Range |
Volume |
Tue 28 October 2025 |
3.34 (-1.18%) |
3.40 |
3.32 - 3.46 |
0.4325 times |
Fri 24 October 2025 |
3.38 (6.96%) |
3.17 |
3.14 - 3.48 |
0.9757 times |
Fri 17 October 2025 |
3.16 (-1.86%) |
3.25 |
3.11 - 3.25 |
0.8679 times |
Fri 10 October 2025 |
3.22 (-4.73%) |
3.41 |
3.18 - 3.41 |
1.0048 times |
Fri 03 October 2025 |
3.38 (0.3%) |
3.40 |
3.31 - 3.40 |
0.7493 times |
Fri 26 September 2025 |
3.37 (-6.65%) |
3.64 |
3.33 - 3.64 |
1.0968 times |
Fri 19 September 2025 |
3.61 (3.74%) |
3.55 |
3.49 - 3.75 |
1.2734 times |
Fri 12 September 2025 |
3.48 (1.46%) |
3.51 |
3.43 - 3.69 |
1.8518 times |
Fri 05 September 2025 |
3.43 (3.31%) |
3.35 |
3.30 - 3.56 |
1.1275 times |
Fri 29 August 2025 |
3.32 (-2.64%) |
3.43 |
3.30 - 3.44 |
0.6202 times |
Fri 22 August 2025 |
3.41 (0%) |
3.46 |
3.40 - 3.51 |
1.2391 times |
Monthly price and charts NandanDenim Strong monthly Stock price targets for NandanDenim NDL are 3.23 and 3.6 | Monthly Target 1 | 2.94 | | Monthly Target 2 | 3.14 | | Monthly Target 3 | 3.31 | | Monthly Target 4 | 3.51 | | Monthly Target 5 | 3.68 |
Monthly price and volumes Nandan Denim
| Date |
Closing |
Open |
Range |
Volume |
Tue 28 October 2025 |
3.34 (0%) |
3.31 |
3.11 - 3.48 |
0.3547 times |
Tue 30 September 2025 |
3.34 (0.6%) |
3.35 |
3.30 - 3.75 |
0.5726 times |
Fri 29 August 2025 |
3.32 (-7.78%) |
3.61 |
3.30 - 3.61 |
0.4688 times |
Thu 31 July 2025 |
3.60 (-6.01%) |
3.85 |
3.40 - 4.20 |
1.5424 times |
Mon 30 June 2025 |
3.83 (-5.2%) |
4.06 |
3.64 - 4.42 |
1.3612 times |
Fri 30 May 2025 |
4.04 (10.99%) |
3.70 |
3.41 - 4.23 |
1.1437 times |
Wed 30 April 2025 |
3.64 (3.7%) |
3.52 |
3.42 - 4.22 |
0.9583 times |
Fri 28 March 2025 |
3.51 (11.43%) |
3.19 |
3.05 - 4.30 |
1.6883 times |
Fri 28 February 2025 |
3.15 (-25.53%) |
4.19 |
3.11 - 5.08 |
1.1027 times |
Fri 31 January 2025 |
4.23 (-12.6%) |
4.89 |
3.81 - 5.18 |
0.8073 times |
Tue 31 December 2024 |
4.84 (-92.24%) |
4.84 |
4.70 - 4.94 |
0.1078 times |
DMA SMA EMA moving averages of Nandan Denim NDL
DMA (daily moving average) of Nandan Denim NDL
| DMA period | DMA value | | 5 day DMA | 3.35 | | 12 day DMA | 3.25 | | 20 day DMA | 3.26 | | 35 day DMA | 3.37 | | 50 day DMA | 3.38 | | 100 day DMA | 3.56 | | 150 day DMA | 3.66 | | 200 day DMA | 3.75 | EMA (exponential moving average) of Nandan Denim NDL
| EMA period | EMA current | EMA prev | EMA prev2 | | 5 day EMA | 3.33 | 3.32 | 3.3 | | 12 day EMA | 3.29 | 3.28 | 3.26 | | 20 day EMA | 3.3 | 3.3 | 3.29 | | 35 day EMA | 3.32 | 3.32 | 3.32 | | 50 day EMA | 3.39 | 3.39 | 3.39 |
SMA (simple moving average) of Nandan Denim NDL
| SMA period | SMA current | SMA prev | SMA prev2 | | 5 day SMA | 3.35 | 3.31 | 3.27 | | 12 day SMA | 3.25 | 3.23 | 3.22 | | 20 day SMA | 3.26 | 3.26 | 3.27 | | 35 day SMA | 3.37 | 3.37 | 3.38 | | 50 day SMA | 3.38 | 3.38 | 3.38 | | 100 day SMA | 3.56 | 3.57 | 3.58 | | 150 day SMA | 3.66 | 3.66 | 3.66 | | 200 day SMA | 3.75 | 3.76 | 3.77 |
|
|
