NazaraTechnologies NAZARA full analysis,charts,indicators,moving averages,SMA,DMA,EMA,ADX,MACD,RSINazara Technologies NAZARA WideScreen charts, DMA,SMA,EMA technical analysis, forecast prediction, by indicators ADX,MACD,RSI,CCI NSE stock exchange
Daily price and charts and targets NazaraTechnologies Strong Daily Stock price targets for NazaraTechnologies NAZARA are 265.2 and 269.85 | Daily Target 1 | 261.63 | | Daily Target 2 | 264.12 | | Daily Target 3 | 266.28333333333 | | Daily Target 4 | 268.77 | | Daily Target 5 | 270.93 |
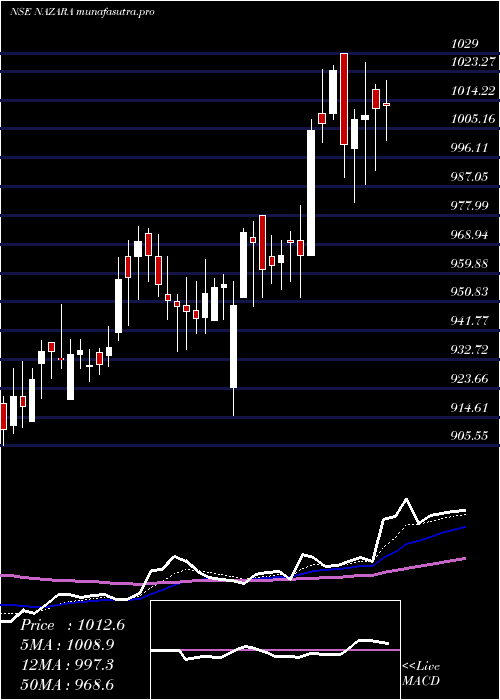
Daily price and volume Nazara Technologies
| Date |
Closing |
Open |
Range |
Volume |
Tue 28 October 2025 |
266.60 (0.81%) |
265.40 |
263.80 - 268.45 |
0.8063 times |
Mon 27 October 2025 |
264.45 (-1.47%) |
269.35 |
261.50 - 269.35 |
0.7725 times |
Fri 24 October 2025 |
268.40 (-0.81%) |
272.80 |
264.00 - 272.80 |
0.5681 times |
Thu 23 October 2025 |
270.60 (-1.02%) |
275.00 |
266.40 - 275.35 |
1.2643 times |
Tue 21 October 2025 |
273.40 (1.07%) |
274.60 |
271.85 - 274.80 |
0.2225 times |
Mon 20 October 2025 |
270.50 (2.17%) |
267.80 |
266.00 - 272.00 |
1.3589 times |
Fri 17 October 2025 |
264.75 (0.8%) |
264.00 |
260.60 - 266.00 |
1.3039 times |
Thu 16 October 2025 |
262.65 (0%) |
265.00 |
260.40 - 267.50 |
0.9563 times |
Wed 15 October 2025 |
262.65 (0.1%) |
264.45 |
257.20 - 264.45 |
2.2895 times |
Tue 14 October 2025 |
262.40 (-2.18%) |
269.80 |
261.70 - 270.00 |
0.4577 times |
Mon 13 October 2025 |
268.25 (1.25%) |
265.00 |
262.30 - 270.30 |
0.8801 times |
Weekly price and charts NazaraTechnologies Strong weekly Stock price targets for NazaraTechnologies NAZARA are 260.13 and 267.98 | Weekly Target 1 | 257.97 | | Weekly Target 2 | 262.28 | | Weekly Target 3 | 265.81666666667 | | Weekly Target 4 | 270.13 | | Weekly Target 5 | 273.67 |
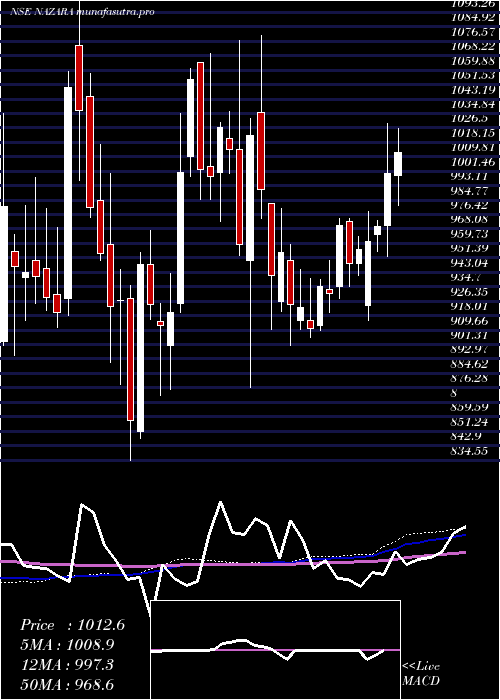
Weekly price and volumes for Nazara Technologies
| Date |
Closing |
Open |
Range |
Volume |
Tue 28 October 2025 |
266.60 (-0.67%) |
269.35 |
261.50 - 269.35 |
0.1827 times |
Fri 24 October 2025 |
268.40 (1.38%) |
267.80 |
264.00 - 275.35 |
0.3951 times |
Fri 17 October 2025 |
264.75 (-0.08%) |
265.00 |
257.20 - 270.30 |
0.6815 times |
Fri 10 October 2025 |
264.95 (-5.56%) |
280.80 |
262.90 - 285.40 |
0.7052 times |
Fri 03 October 2025 |
280.55 (0.2%) |
279.90 |
251.95 - 281.00 |
2.9056 times |
Fri 26 September 2025 |
280.00 (-74.16%) |
1090.00 |
277.60 - 1127.70 |
0.627 times |
Fri 19 September 2025 |
1083.50 (-1.21%) |
1100.00 |
1079.20 - 1122.40 |
0.3468 times |
Fri 12 September 2025 |
1096.80 (-0.59%) |
1111.00 |
1062.80 - 1123.90 |
0.3892 times |
Fri 05 September 2025 |
1103.30 (-4.98%) |
1163.00 |
1088.00 - 1177.90 |
0.783 times |
Fri 29 August 2025 |
1161.10 (0.35%) |
1152.00 |
1016.00 - 1183.30 |
2.9839 times |
Fri 22 August 2025 |
1157.00 (-18.21%) |
1418.00 |
1085.00 - 1418.00 |
3.6138 times |
Monthly price and charts NazaraTechnologies Strong monthly Stock price targets for NazaraTechnologies NAZARA are 259.28 and 292.73 | Monthly Target 1 | 234.53 | | Monthly Target 2 | 250.57 | | Monthly Target 3 | 267.98333333333 | | Monthly Target 4 | 284.02 | | Monthly Target 5 | 301.43 |
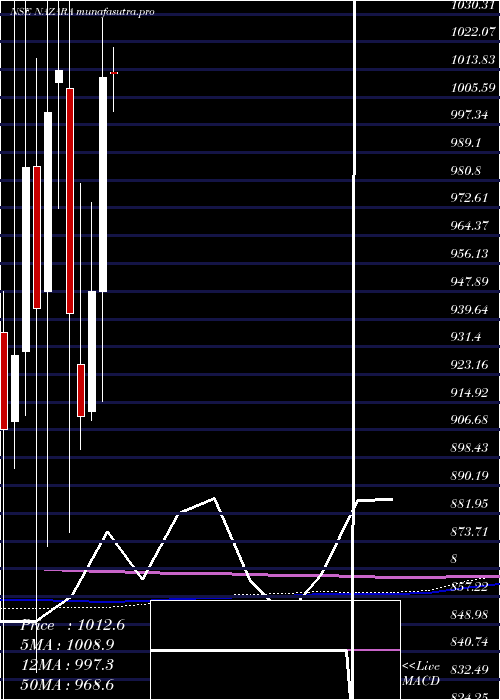
Monthly price and volumes Nazara Technologies
| Date |
Closing |
Open |
Range |
Volume |
Tue 28 October 2025 |
266.60 (4.71%) |
255.80 |
251.95 - 285.40 |
1.5758 times |
Tue 30 September 2025 |
254.60 (-78.07%) |
1163.00 |
253.00 - 1177.90 |
0.9241 times |
Fri 29 August 2025 |
1161.10 (-14.08%) |
1354.50 |
1016.00 - 1453.00 |
2.6848 times |
Thu 31 July 2025 |
1351.40 (4.07%) |
1309.00 |
1290.10 - 1436.00 |
0.849 times |
Mon 30 June 2025 |
1298.60 (0.27%) |
1303.00 |
1215.30 - 1355.00 |
1.2872 times |
Fri 30 May 2025 |
1295.10 (28.04%) |
1013.00 |
989.10 - 1326.50 |
1.1757 times |
Wed 30 April 2025 |
1011.50 (6.71%) |
948.00 |
915.00 - 1029.00 |
0.3629 times |
Fri 28 March 2025 |
947.90 (4.07%) |
912.10 |
909.55 - 974.40 |
0.2617 times |
Fri 28 February 2025 |
910.85 (-3.22%) |
926.10 |
901.00 - 979.90 |
0.2833 times |
Fri 31 January 2025 |
941.15 (-7.14%) |
1008.25 |
876.25 - 1080.00 |
0.5956 times |
Tue 31 December 2024 |
1013.50 (1.26%) |
1010.05 |
972.60 - 1069.60 |
0.3362 times |
DMA SMA EMA moving averages of Nazara Technologies NAZARA
DMA (daily moving average) of Nazara Technologies NAZARA
| DMA period | DMA value | | 5 day DMA | 268.69 | | 12 day DMA | 266.63 | | 20 day DMA | 268.25 | | 35 day DMA | 601.23 | | 50 day DMA | 780.88 | | 100 day DMA | 1063.18 | | 150 day DMA | 1071.05 | | 200 day DMA | 1040.25 | EMA (exponential moving average) of Nazara Technologies NAZARA
| EMA period | EMA current | EMA prev | EMA prev2 | | 5 day EMA | 267.39 | 267.78 | 269.45 | | 12 day EMA | 292.95 | 297.74 | 303.79 | | 20 day EMA | 374.51 | 385.86 | 398.63 | | 35 day EMA | 552.93 | 569.79 | 587.77 | | 50 day EMA | 780.92 | 801.9 | 823.83 |
SMA (simple moving average) of Nazara Technologies NAZARA
| SMA period | SMA current | SMA prev | SMA prev2 | | 5 day SMA | 268.69 | 269.47 | 269.53 | | 12 day SMA | 266.63 | 266.73 | 266.87 | | 20 day SMA | 268.25 | 268.92 | 311.5 | | 35 day SMA | 601.23 | 625.14 | 649.21 | | 50 day SMA | 780.88 | 803.84 | 826.97 | | 100 day SMA | 1063.18 | 1072.98 | 1083.02 | | 150 day SMA | 1071.05 | 1075.66 | 1080.14 | | 200 day SMA | 1040.25 | 1043.82 | 1047.57 |
|
|
