NavkarUrbanstructure NAVKARURB_BE full analysis,charts,indicators,moving averages,SMA,DMA,EMA,ADX,MACD,RSINavkar Urbanstructure NAVKARURB_BE WideScreen charts, DMA,SMA,EMA technical analysis, forecast prediction, by indicators ADX,MACD,RSI,CCI NSE stock exchange
Daily price and charts and targets NavkarUrbanstructure Strong Daily Stock price targets for NavkarUrbanstructure NAVKARURB_BE are 2.37 and 2.59 | Daily Target 1 | 2.19 | | Daily Target 2 | 2.34 | | Daily Target 3 | 2.4133333333333 | | Daily Target 4 | 2.56 | | Daily Target 5 | 2.63 |
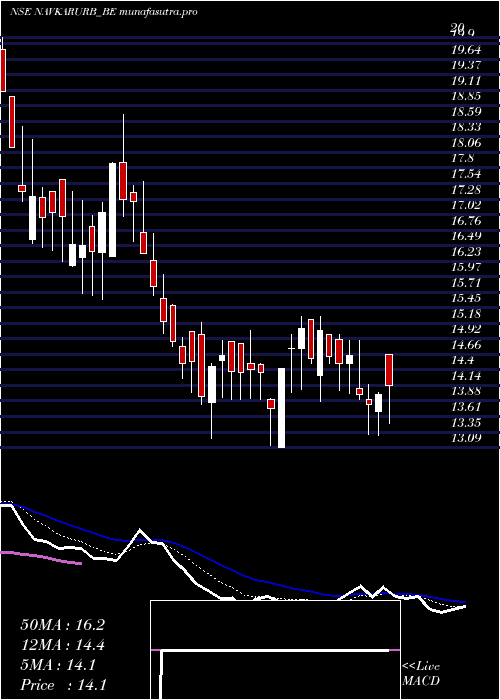
Daily price and volume Navkar Urbanstructure
| Date |
Closing |
Open |
Range |
Volume |
Tue 28 October 2025 |
2.48 (4.2%) |
2.48 |
2.27 - 2.49 |
1.4042 times |
Mon 27 October 2025 |
2.38 (4.39%) |
2.35 |
2.18 - 2.39 |
0.9928 times |
Fri 24 October 2025 |
2.28 (1.79%) |
2.24 |
2.24 - 2.28 |
0.6726 times |
Thu 23 October 2025 |
2.24 (1.82%) |
2.20 |
2.20 - 2.24 |
0.1762 times |
Tue 21 October 2025 |
2.20 (1.85%) |
2.20 |
2.20 - 2.20 |
0.0213 times |
Mon 20 October 2025 |
2.16 (-2.26%) |
2.16 |
2.16 - 2.16 |
0.3507 times |
Fri 17 October 2025 |
2.21 (-2.21%) |
2.21 |
2.21 - 2.25 |
1.5739 times |
Thu 16 October 2025 |
2.26 (1.35%) |
2.24 |
2.20 - 2.26 |
2.0903 times |
Wed 15 October 2025 |
2.23 (1.83%) |
2.18 |
2.16 - 2.23 |
1.199 times |
Tue 14 October 2025 |
2.19 (-2.23%) |
2.20 |
2.19 - 2.22 |
1.5189 times |
Mon 13 October 2025 |
2.24 (-2.18%) |
2.29 |
2.24 - 2.29 |
0.6094 times |
Weekly price and charts NavkarUrbanstructure Strong weekly Stock price targets for NavkarUrbanstructure NAVKARURB_BE are 2.33 and 2.64 | Weekly Target 1 | 2.07 | | Weekly Target 2 | 2.28 | | Weekly Target 3 | 2.3833333333333 | | Weekly Target 4 | 2.59 | | Weekly Target 5 | 2.69 |
Weekly price and volumes for Navkar Urbanstructure
| Date |
Closing |
Open |
Range |
Volume |
Tue 28 October 2025 |
2.48 (8.77%) |
2.35 |
2.18 - 2.49 |
0.3618 times |
Fri 24 October 2025 |
2.28 (3.17%) |
2.16 |
2.16 - 2.28 |
0.1842 times |
Fri 17 October 2025 |
2.21 (-3.49%) |
2.29 |
2.16 - 2.29 |
1.0552 times |
Fri 10 October 2025 |
2.29 (-0.43%) |
2.34 |
2.16 - 2.34 |
0.5545 times |
Fri 03 October 2025 |
2.30 (-8.37%) |
2.45 |
2.30 - 2.49 |
0.2656 times |
Fri 26 September 2025 |
2.51 (-10.99%) |
2.76 |
2.51 - 2.76 |
0.4591 times |
Fri 19 September 2025 |
2.82 (9.3%) |
2.57 |
2.48 - 2.93 |
3.0392 times |
Fri 12 September 2025 |
2.58 (0.39%) |
2.63 |
2.39 - 2.63 |
2.1746 times |
Fri 05 September 2025 |
2.57 (7.08%) |
2.52 |
2.38 - 2.62 |
1.1887 times |
Fri 29 August 2025 |
2.40 (-0.41%) |
2.40 |
2.08 - 2.40 |
0.717 times |
Fri 22 August 2025 |
2.41 (-5.49%) |
2.64 |
2.36 - 2.65 |
2.9634 times |
Monthly price and charts NavkarUrbanstructure Strong monthly Stock price targets for NavkarUrbanstructure NAVKARURB_BE are 2.32 and 2.65 | Monthly Target 1 | 2.05 | | Monthly Target 2 | 2.26 | | Monthly Target 3 | 2.3766666666667 | | Monthly Target 4 | 2.59 | | Monthly Target 5 | 2.71 |
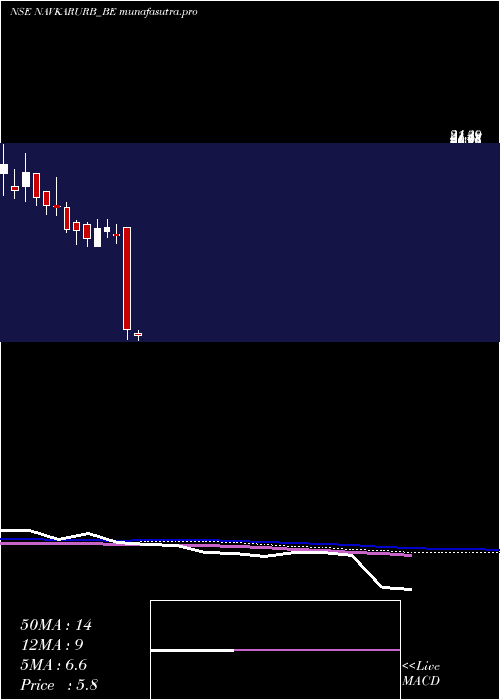
Monthly price and volumes Navkar Urbanstructure
| Date |
Closing |
Open |
Range |
Volume |
Tue 28 October 2025 |
2.48 (3.33%) |
2.35 |
2.16 - 2.49 |
0.6262 times |
Tue 30 September 2025 |
2.40 (0%) |
2.52 |
2.38 - 2.93 |
1.9605 times |
Fri 29 August 2025 |
2.40 (6.67%) |
2.20 |
2.08 - 2.65 |
1.6153 times |
Thu 31 July 2025 |
2.25 (19.05%) |
1.98 |
1.98 - 2.36 |
2.3736 times |
Mon 30 June 2025 |
1.89 (-67.36%) |
1.70 |
1.47 - 1.89 |
0.7573 times |
Fri 02 May 2025 |
5.79 (-0.52%) |
5.93 |
5.60 - 5.94 |
0.0957 times |
Wed 30 April 2025 |
5.82 (-57.64%) |
13.09 |
5.43 - 15.30 |
0.6773 times |
Fri 28 March 2025 |
13.74 (-16.22%) |
16.38 |
13.12 - 18.70 |
0.3473 times |
Fri 28 February 2025 |
16.40 (-17.21%) |
18.01 |
15.66 - 20.69 |
0.7578 times |
Fri 31 January 2025 |
19.81 (0%) |
16.50 |
16.20 - 21.40 |
0.7891 times |
Wed 29 October 2025 |
(0%) |
|
- |
0 times |

DMA SMA EMA moving averages of Navkar Urbanstructure NAVKARURB_BE
DMA (daily moving average) of Navkar Urbanstructure NAVKARURB_BE
| DMA period | DMA value | | 5 day DMA | 2.32 | | 12 day DMA | 2.26 | | 20 day DMA | 2.28 | | 35 day DMA | 2.44 | | 50 day DMA | 2.45 | | 100 day DMA | 2.86 | | 150 day DMA | 7.39 | | 200 day DMA | | EMA (exponential moving average) of Navkar Urbanstructure NAVKARURB_BE
| EMA period | EMA current | EMA prev | EMA prev2 | | 5 day EMA | 2.35 | 2.29 | 2.24 | | 12 day EMA | 2.31 | 2.28 | 2.26 | | 20 day EMA | 2.34 | 2.32 | 2.31 | | 35 day EMA | 2.37 | 2.36 | 2.36 | | 50 day EMA | 2.43 | 2.43 | 2.43 |
SMA (simple moving average) of Navkar Urbanstructure NAVKARURB_BE
| SMA period | SMA current | SMA prev | SMA prev2 | | 5 day SMA | 2.32 | 2.25 | 2.22 | | 12 day SMA | 2.26 | 2.24 | 2.23 | | 20 day SMA | 2.28 | 2.29 | 2.3 | | 35 day SMA | 2.44 | 2.44 | 2.45 | | 50 day SMA | 2.45 | 2.45 | 2.45 | | 100 day SMA | 2.86 | 2.98 | 3.09 | | 150 day SMA | 7.39 | 7.51 | 7.62 | | 200 day SMA |
|
|
