NavkarCorporation NAVKARCORP full analysis,charts,indicators,moving averages,SMA,DMA,EMA,ADX,MACD,RSINavkar Corporation NAVKARCORP WideScreen charts, DMA,SMA,EMA technical analysis, forecast prediction, by indicators ADX,MACD,RSI,CCI NSE stock exchange
Daily price and charts and targets NavkarCorporation Strong Daily Stock price targets for NavkarCorporation NAVKARCORP are 118.1 and 120.4 | Daily Target 1 | 117.63 | | Daily Target 2 | 118.56 | | Daily Target 3 | 119.93 | | Daily Target 4 | 120.86 | | Daily Target 5 | 122.23 |
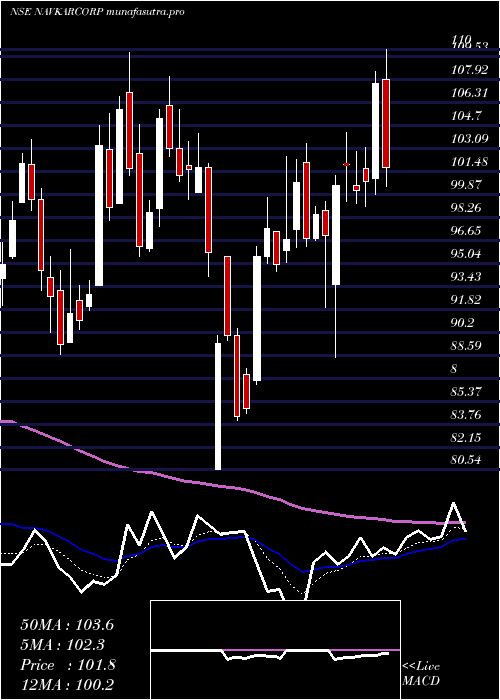
Daily price and volume Navkar Corporation
| Date |
Closing |
Open |
Range |
Volume |
Wed 29 October 2025 |
119.49 (-0.14%) |
120.90 |
119.00 - 121.30 |
0.5752 times |
Tue 28 October 2025 |
119.66 (-0.57%) |
121.30 |
119.44 - 121.70 |
0.5883 times |
Mon 27 October 2025 |
120.34 (-2.18%) |
123.70 |
119.73 - 124.90 |
0.7363 times |
Fri 24 October 2025 |
123.02 (1.65%) |
121.90 |
121.30 - 126.72 |
1.6982 times |
Thu 23 October 2025 |
121.02 (-1.1%) |
122.51 |
120.40 - 122.85 |
0.3186 times |
Tue 21 October 2025 |
122.36 (1.28%) |
122.70 |
121.70 - 123.50 |
0.2578 times |
Mon 20 October 2025 |
120.81 (0.16%) |
120.03 |
120.03 - 122.37 |
0.4431 times |
Fri 17 October 2025 |
120.62 (-0.49%) |
122.45 |
119.10 - 122.90 |
0.7766 times |
Thu 16 October 2025 |
121.22 (-1.74%) |
123.00 |
120.55 - 125.66 |
1.127 times |
Wed 15 October 2025 |
123.37 (-3.89%) |
129.50 |
122.53 - 131.36 |
3.479 times |
Tue 14 October 2025 |
128.37 (6.21%) |
121.27 |
120.83 - 131.28 |
8.8688 times |
Weekly price and charts NavkarCorporation Strong weekly Stock price targets for NavkarCorporation NAVKARCORP are 116.3 and 122.2 | Weekly Target 1 | 115.23 | | Weekly Target 2 | 117.36 | | Weekly Target 3 | 121.13 | | Weekly Target 4 | 123.26 | | Weekly Target 5 | 127.03 |
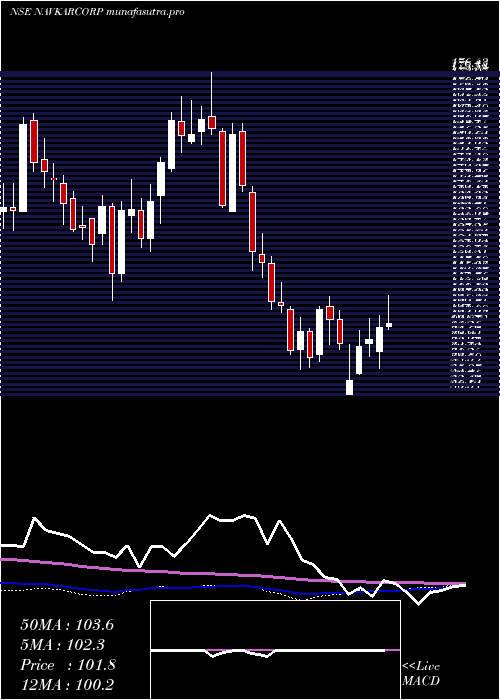
Weekly price and volumes for Navkar Corporation
| Date |
Closing |
Open |
Range |
Volume |
Wed 29 October 2025 |
119.49 (-2.87%) |
123.70 |
119.00 - 124.90 |
0.4087 times |
Fri 24 October 2025 |
123.02 (1.99%) |
120.03 |
120.03 - 126.72 |
0.5846 times |
Fri 17 October 2025 |
120.62 (1.32%) |
119.53 |
118.00 - 131.36 |
3.1811 times |
Fri 10 October 2025 |
119.05 (-4.76%) |
125.00 |
116.85 - 125.01 |
0.7213 times |
Fri 03 October 2025 |
125.00 (4.24%) |
121.70 |
118.06 - 128.48 |
0.6335 times |
Fri 26 September 2025 |
119.91 (-6.43%) |
128.89 |
118.50 - 129.66 |
0.6458 times |
Fri 19 September 2025 |
128.15 (2.79%) |
124.00 |
122.50 - 132.00 |
1.014 times |
Fri 12 September 2025 |
124.67 (7.81%) |
115.99 |
115.90 - 132.50 |
1.7947 times |
Fri 05 September 2025 |
115.64 (-1.18%) |
118.20 |
115.10 - 121.29 |
0.5942 times |
Fri 29 August 2025 |
117.02 (-3.22%) |
122.00 |
116.41 - 123.25 |
0.4222 times |
Fri 22 August 2025 |
120.91 (1.96%) |
120.90 |
119.27 - 127.75 |
1.1614 times |
Monthly price and charts NavkarCorporation Strong monthly Stock price targets for NavkarCorporation NAVKARCORP are 110.92 and 125.43 | Monthly Target 1 | 108.06 | | Monthly Target 2 | 113.77 | | Monthly Target 3 | 122.56666666667 | | Monthly Target 4 | 128.28 | | Monthly Target 5 | 137.08 |
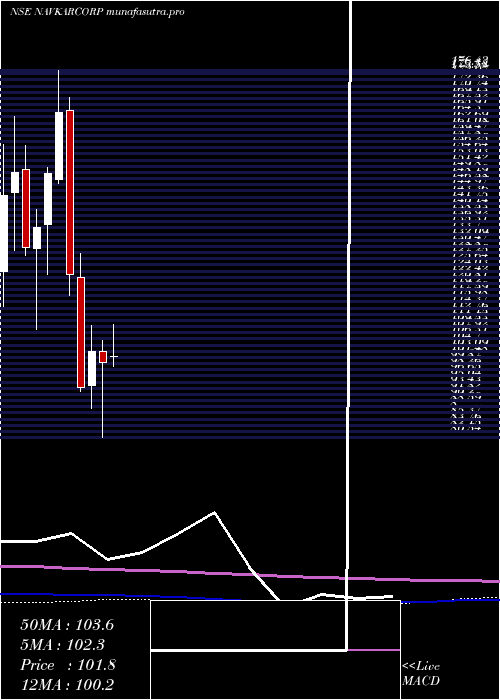
Monthly price and volumes Navkar Corporation
| Date |
Closing |
Open |
Range |
Volume |
Wed 29 October 2025 |
119.49 (-1.34%) |
121.11 |
116.85 - 131.36 |
0.6996 times |
Tue 30 September 2025 |
121.11 (3.5%) |
118.20 |
115.10 - 132.50 |
0.5516 times |
Fri 29 August 2025 |
117.02 (-11.36%) |
132.21 |
116.15 - 132.79 |
0.5698 times |
Thu 31 July 2025 |
132.01 (20.05%) |
110.75 |
103.50 - 140.20 |
2.227 times |
Mon 30 June 2025 |
109.96 (-3.07%) |
113.44 |
107.00 - 120.75 |
0.5696 times |
Fri 30 May 2025 |
113.44 (13.29%) |
101.65 |
96.26 - 119.00 |
1.2295 times |
Wed 30 April 2025 |
100.13 (-2.87%) |
103.10 |
80.54 - 105.79 |
1.1105 times |
Fri 28 March 2025 |
103.09 (10.09%) |
94.01 |
88.00 - 109.80 |
1.1428 times |
Fri 28 February 2025 |
93.64 (-23.99%) |
122.36 |
92.61 - 128.70 |
0.5663 times |
Fri 31 January 2025 |
123.20 (-25.52%) |
165.89 |
117.63 - 169.45 |
1.3332 times |
Tue 31 December 2024 |
165.41 (10.56%) |
147.92 |
147.00 - 176.43 |
1.5856 times |
DMA SMA EMA moving averages of Navkar Corporation NAVKARCORP
DMA (daily moving average) of Navkar Corporation NAVKARCORP
| DMA period | DMA value | | 5 day DMA | 120.71 | | 12 day DMA | 121.76 | | 20 day DMA | 121.66 | | 35 day DMA | 123.13 | | 50 day DMA | 122.27 | | 100 day DMA | 119.62 | | 150 day DMA | 113.93 | | 200 day DMA | 115.08 | EMA (exponential moving average) of Navkar Corporation NAVKARCORP
| EMA period | EMA current | EMA prev | EMA prev2 | | 5 day EMA | 120.41 | 120.87 | 121.47 | | 12 day EMA | 121.12 | 121.42 | 121.74 | | 20 day EMA | 121.54 | 121.76 | 121.98 | | 35 day EMA | 121.66 | 121.79 | 121.92 | | 50 day EMA | 121.85 | 121.95 | 122.04 |
SMA (simple moving average) of Navkar Corporation NAVKARCORP
| SMA period | SMA current | SMA prev | SMA prev2 | | 5 day SMA | 120.71 | 121.28 | 121.51 | | 12 day SMA | 121.76 | 121.73 | 121.71 | | 20 day SMA | 121.66 | 121.64 | 121.66 | | 35 day SMA | 123.13 | 123.32 | 123.21 | | 50 day SMA | 122.27 | 122.25 | 122.29 | | 100 day SMA | 119.62 | 119.53 | 119.43 | | 150 day SMA | 113.93 | 113.79 | 113.68 | | 200 day SMA | 115.08 | 115.24 | 115.38 |
|
|
