NathBio NATHBIOGEN_BE full analysis,charts,indicators,moving averages,SMA,DMA,EMA,ADX,MACD,RSINath Bio NATHBIOGEN_BE WideScreen charts, DMA,SMA,EMA technical analysis, forecast prediction, by indicators ADX,MACD,RSI,CCI NSE stock exchange
Daily price and charts and targets NathBio Strong Daily Stock price targets for NathBio NATHBIOGEN_BE are 187.11 and 194.68 | Daily Target 1 | 185.59 | | Daily Target 2 | 188.63 | | Daily Target 3 | 193.15666666667 | | Daily Target 4 | 196.2 | | Daily Target 5 | 200.73 |
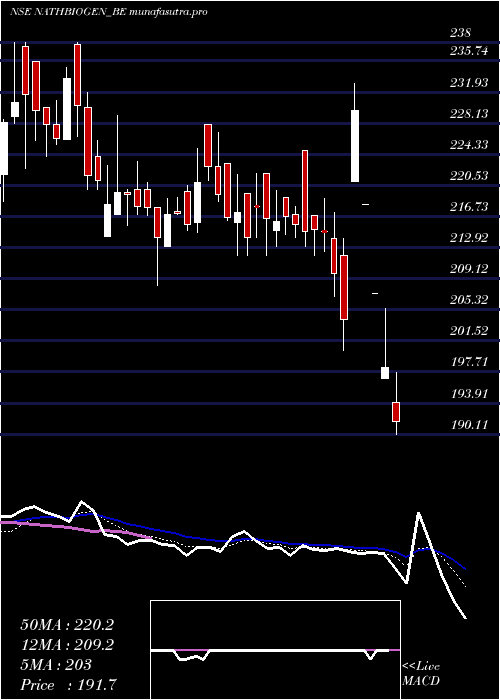
Daily price and volume Nath Bio
| Date |
Closing |
Open |
Range |
Volume |
Thu 17 July 2025 |
191.68 (-3.32%) |
194.00 |
190.11 - 197.68 |
1.4388 times |
Wed 16 July 2025 |
198.26 (-4.35%) |
196.90 |
196.90 - 205.50 |
4.6223 times |
Tue 15 July 2025 |
207.27 (-5%) |
207.27 |
207.27 - 207.27 |
0.2071 times |
Mon 14 July 2025 |
218.18 (-5%) |
218.18 |
218.18 - 218.18 |
0.4971 times |
Fri 11 July 2025 |
229.67 (12.52%) |
221.00 |
221.00 - 233.00 |
1.6324 times |
Mon 07 October 2024 |
204.11 (-2.67%) |
212.00 |
200.30 - 214.00 |
0.4763 times |
Fri 04 October 2024 |
209.72 (-2.4%) |
214.00 |
207.00 - 217.21 |
0.2047 times |
Thu 03 October 2024 |
214.88 (-0.13%) |
214.95 |
212.50 - 218.90 |
0.2615 times |
Tue 01 October 2024 |
215.15 (0.13%) |
216.85 |
212.00 - 216.85 |
0.3169 times |
Mon 30 September 2024 |
214.86 (-0.43%) |
224.79 |
213.01 - 224.79 |
0.3429 times |
Fri 27 September 2024 |
215.79 (-0.41%) |
217.00 |
214.12 - 218.00 |
0.1603 times |
Weekly price and charts NathBio Strong weekly Stock price targets for NathBio NATHBIOGEN_BE are 176.86 and 204.93 | Weekly Target 1 | 171.92 | | Weekly Target 2 | 181.8 | | Weekly Target 3 | 199.99 | | Weekly Target 4 | 209.87 | | Weekly Target 5 | 228.06 |
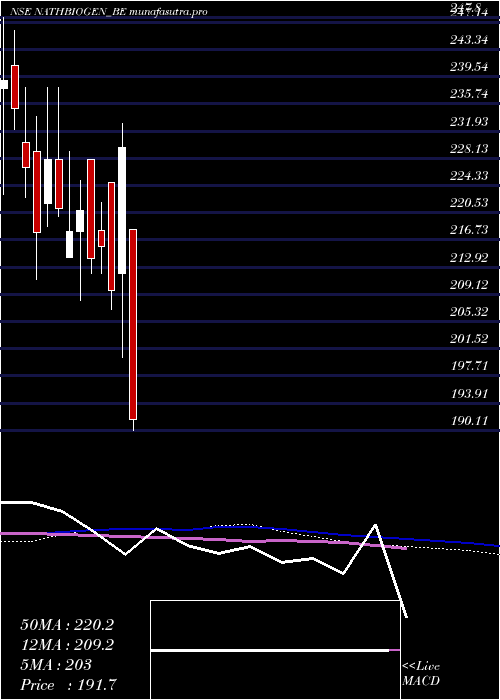
Weekly price and volumes for Nath Bio
| Date |
Closing |
Open |
Range |
Volume |
Thu 17 July 2025 |
191.68 (-16.54%) |
218.18 |
190.11 - 218.18 |
2.64 times |
Fri 11 July 2025 |
229.67 (9.51%) |
212.00 |
200.30 - 233.00 |
0.8228 times |
Fri 04 October 2024 |
209.72 (-2.81%) |
224.79 |
207.00 - 224.79 |
0.4394 times |
Fri 27 September 2024 |
215.79 (0.75%) |
218.00 |
212.00 - 222.00 |
0.4922 times |
Fri 20 September 2024 |
214.18 (-3.03%) |
228.00 |
212.00 - 228.00 |
0.6712 times |
Fri 13 September 2024 |
220.87 (1.39%) |
217.84 |
208.30 - 225.00 |
0.8938 times |
Fri 06 September 2024 |
217.84 (-1.48%) |
214.31 |
214.31 - 229.04 |
0.7107 times |
Fri 30 August 2024 |
221.12 (-3.01%) |
227.99 |
220.00 - 238.00 |
1.0521 times |
Fri 23 August 2024 |
227.99 (4.7%) |
221.80 |
218.60 - 238.00 |
1.4878 times |
Fri 16 August 2024 |
217.75 (-4.02%) |
229.00 |
211.15 - 233.95 |
0.79 times |
Fri 09 August 2024 |
226.86 (-3.5%) |
230.30 |
222.70 - 238.00 |
1.5406 times |
Monthly price and charts NathBio Strong monthly Stock price targets for NathBio NATHBIOGEN_BE are 169.45 and 212.34 | Monthly Target 1 | 162.04 | | Monthly Target 2 | 176.86 | | Monthly Target 3 | 204.93 | | Monthly Target 4 | 219.75 | | Monthly Target 5 | 247.82 |
Monthly price and volumes Nath Bio
| Date |
Closing |
Open |
Range |
Volume |
Thu 17 July 2025 |
191.68 (-6.09%) |
221.00 |
190.11 - 233.00 |
0.9965 times |
Mon 07 October 2024 |
204.11 (-5%) |
216.85 |
200.30 - 218.90 |
0.1494 times |
Mon 30 September 2024 |
214.86 (-2.83%) |
214.31 |
208.30 - 229.04 |
0.8824 times |
Fri 30 August 2024 |
221.12 (-7.99%) |
240.60 |
211.15 - 245.00 |
1.6257 times |
Wed 31 July 2024 |
240.32 (0%) |
242.60 |
223.00 - 247.90 |
1.346 times |
Thu 17 July 2025 |
(0%) |
|
- |
0 times |

DMA SMA EMA moving averages of Nath Bio NATHBIOGEN_BE
DMA (daily moving average) of Nath Bio NATHBIOGEN_BE
| DMA period | DMA value | | 5 day DMA | 209.01 | | 12 day DMA | 211.35 | | 20 day DMA | 213.86 | | 35 day DMA | 216.8 | | 50 day DMA | 219.69 | | 100 day DMA | | | 150 day DMA | | | 200 day DMA | | EMA (exponential moving average) of Nath Bio NATHBIOGEN_BE
| EMA period | EMA current | EMA prev | EMA prev2 | | 5 day EMA | 203.03 | 208.71 | 213.93 | | 12 day EMA | 209.24 | 212.43 | 215 | | 20 day EMA | 212.35 | 214.53 | 216.24 | | 35 day EMA | 216.57 | 218.04 | 219.2 | | 50 day EMA | 220.15 | 221.31 | 222.25 |
SMA (simple moving average) of Nath Bio NATHBIOGEN_BE
| SMA period | SMA current | SMA prev | SMA prev2 | | 5 day SMA | 209.01 | 211.5 | 213.79 | | 12 day SMA | 211.35 | 213.39 | 214.9 | | 20 day SMA | 213.86 | 215.32 | 216.19 | | 35 day SMA | 216.8 | 217.84 | 218.74 | | 50 day SMA | 219.69 | 220.65 | 221.49 | | 100 day SMA | | 150 day SMA | | 200 day SMA |
|
|
