NatcoPharma NATCOPHARM full analysis,charts,indicators,moving averages,SMA,DMA,EMA,ADX,MACD,RSINatco Pharma NATCOPHARM WideScreen charts, DMA,SMA,EMA technical analysis, forecast prediction, by indicators ADX,MACD,RSI,CCI NSE stock exchange
operates under Pharmaceuticals sector
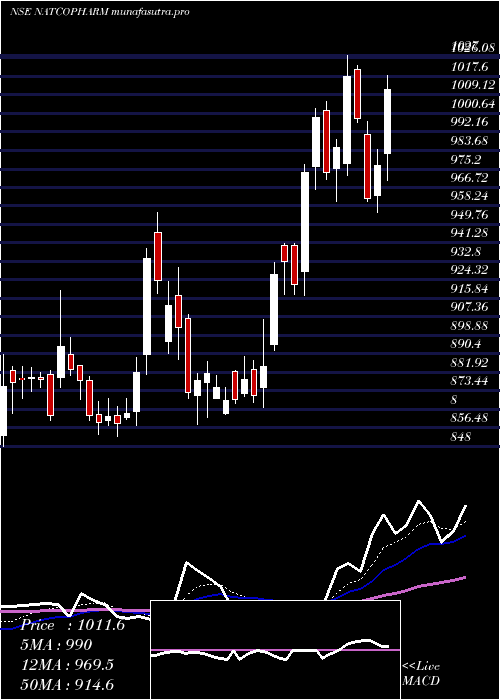
Daily price and charts and targets NatcoPharma Strong Daily Stock price targets for NatcoPharma NATCOPHARM are 821.18 and 830.33 | Daily Target 1 | 819.4 | | Daily Target 2 | 822.95 | | Daily Target 3 | 828.55 | | Daily Target 4 | 832.1 | | Daily Target 5 | 837.7 |
Daily price and volume Natco Pharma
| Date |
Closing |
Open |
Range |
Volume |
Tue 28 October 2025 |
826.50 (0.18%) |
829.90 |
825.00 - 834.15 |
0.5983 times |
Mon 27 October 2025 |
825.05 (0.02%) |
830.80 |
820.00 - 835.00 |
1.0887 times |
Fri 24 October 2025 |
824.90 (-1.11%) |
838.80 |
823.05 - 838.80 |
0.5912 times |
Thu 23 October 2025 |
834.20 (-0.93%) |
848.00 |
831.30 - 849.45 |
0.8758 times |
Tue 21 October 2025 |
842.00 (1%) |
838.00 |
834.35 - 844.40 |
0.3698 times |
Mon 20 October 2025 |
833.65 (0.9%) |
836.00 |
826.85 - 837.60 |
0.7123 times |
Fri 17 October 2025 |
826.20 (0.53%) |
824.90 |
815.45 - 847.90 |
2.2454 times |
Thu 16 October 2025 |
821.85 (0.2%) |
822.00 |
818.00 - 824.90 |
0.5257 times |
Wed 15 October 2025 |
820.25 (1.3%) |
815.80 |
808.55 - 821.95 |
0.8377 times |
Tue 14 October 2025 |
809.70 (-3.58%) |
839.00 |
802.05 - 840.65 |
2.1551 times |
Mon 13 October 2025 |
839.80 (-0.71%) |
846.00 |
836.00 - 847.80 |
0.97 times |
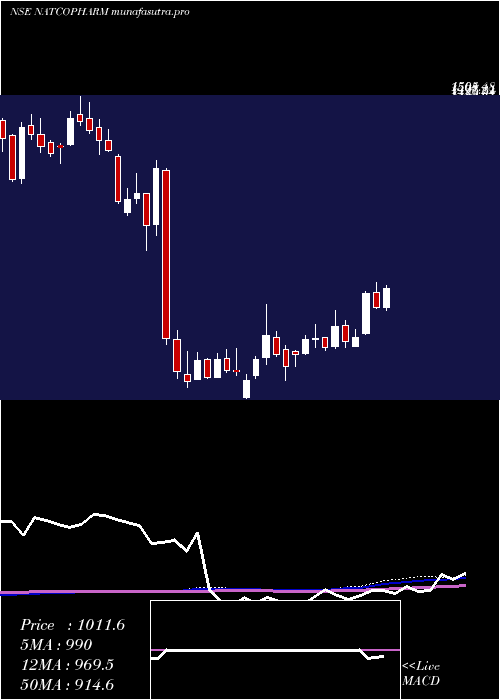
Weekly price and charts NatcoPharma Strong weekly Stock price targets for NatcoPharma NATCOPHARM are 815.75 and 830.75 | Weekly Target 1 | 812.17 | | Weekly Target 2 | 819.33 | | Weekly Target 3 | 827.16666666667 | | Weekly Target 4 | 834.33 | | Weekly Target 5 | 842.17 |
Weekly price and volumes for Natco Pharma
| Date |
Closing |
Open |
Range |
Volume |
Tue 28 October 2025 |
826.50 (0.19%) |
830.80 |
820.00 - 835.00 |
0.3105 times |
Fri 24 October 2025 |
824.90 (-0.16%) |
836.00 |
823.05 - 849.45 |
0.4691 times |
Fri 17 October 2025 |
826.20 (-2.32%) |
846.00 |
802.05 - 847.90 |
1.2393 times |
Fri 10 October 2025 |
845.80 (2.83%) |
830.00 |
806.40 - 864.80 |
2.3956 times |
Fri 03 October 2025 |
822.55 (0.22%) |
820.75 |
789.00 - 825.10 |
0.8206 times |
Fri 26 September 2025 |
820.75 (-7.18%) |
884.25 |
796.90 - 884.25 |
1.2517 times |
Fri 19 September 2025 |
884.25 (2.56%) |
864.95 |
847.40 - 896.95 |
1.3361 times |
Fri 12 September 2025 |
862.20 (1.11%) |
857.40 |
840.00 - 864.80 |
0.8111 times |
Fri 05 September 2025 |
852.75 (-1.07%) |
862.95 |
850.15 - 885.00 |
0.7853 times |
Fri 29 August 2025 |
862.00 (-2.32%) |
884.05 |
849.00 - 891.95 |
0.5808 times |
Fri 22 August 2025 |
882.45 (0.91%) |
883.95 |
871.65 - 895.30 |
0.8669 times |
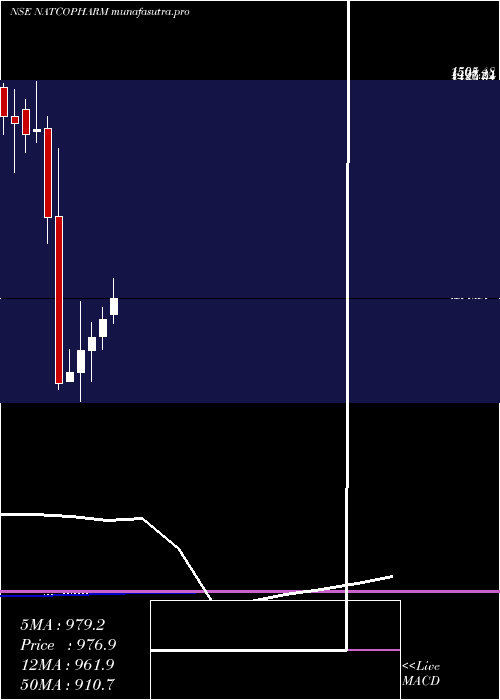
Monthly price and charts NatcoPharma Strong monthly Stock price targets for NatcoPharma NATCOPHARM are 811.63 and 879.68 | Monthly Target 1 | 761.3 | | Monthly Target 2 | 793.9 | | Monthly Target 3 | 829.35 | | Monthly Target 4 | 861.95 | | Monthly Target 5 | 897.4 |
Monthly price and volumes Natco Pharma
| Date |
Closing |
Open |
Range |
Volume |
Tue 28 October 2025 |
826.50 (3.89%) |
799.90 |
796.75 - 864.80 |
0.541 times |
Tue 30 September 2025 |
795.55 (-7.71%) |
862.95 |
789.00 - 896.95 |
0.5351 times |
Fri 29 August 2025 |
862.00 (-9.59%) |
952.75 |
849.00 - 953.00 |
0.5022 times |
Thu 31 July 2025 |
953.40 (2.89%) |
939.90 |
917.05 - 1059.00 |
1.9607 times |
Mon 30 June 2025 |
926.65 (4.9%) |
885.00 |
852.55 - 955.00 |
1.0282 times |
Fri 30 May 2025 |
883.40 (3.82%) |
850.90 |
775.00 - 919.50 |
0.8142 times |
Wed 30 April 2025 |
850.90 (6.53%) |
798.75 |
726.80 - 970.00 |
1.6138 times |
Fri 28 March 2025 |
798.75 (3.64%) |
776.75 |
776.75 - 852.90 |
0.7269 times |
Fri 28 February 2025 |
770.70 (-34.34%) |
1177.00 |
757.05 - 1341.00 |
1.7519 times |
Fri 31 January 2025 |
1173.85 (-15.39%) |
1389.80 |
1110.00 - 1420.00 |
0.526 times |
Tue 31 December 2024 |
1387.30 (0.86%) |
1383.00 |
1356.65 - 1505.00 |
0.7026 times |
DMA SMA EMA moving averages of Natco Pharma NATCOPHARM
DMA (daily moving average) of Natco Pharma NATCOPHARM
| DMA period | DMA value | | 5 day DMA | 830.53 | | 12 day DMA | 829.16 | | 20 day DMA | 820.95 | | 35 day DMA | 835.08 | | 50 day DMA | 845.84 | | 100 day DMA | 891.97 | | 150 day DMA | 873.91 | | 200 day DMA | 917.47 | EMA (exponential moving average) of Natco Pharma NATCOPHARM
| EMA period | EMA current | EMA prev | EMA prev2 | | 5 day EMA | 827.75 | 828.38 | 830.05 | | 12 day EMA | 827.68 | 827.89 | 828.41 | | 20 day EMA | 829.77 | 830.11 | 830.64 | | 35 day EMA | 838.11 | 838.79 | 839.6 | | 50 day EMA | 849.43 | 850.37 | 851.4 |
SMA (simple moving average) of Natco Pharma NATCOPHARM
| SMA period | SMA current | SMA prev | SMA prev2 | | 5 day SMA | 830.53 | 831.96 | 832.19 | | 12 day SMA | 829.16 | 828.08 | 826.74 | | 20 day SMA | 820.95 | 820.67 | 821.53 | | 35 day SMA | 835.08 | 835.83 | 836.7 | | 50 day SMA | 845.84 | 847.39 | 848.66 | | 100 day SMA | 891.97 | 892.3 | 892.67 | | 150 day SMA | 873.91 | 873.9 | 873.78 | | 200 day SMA | 917.47 | 919.88 | 922.59 |
|
|
