NamanIn NAMAN_SM full analysis,charts,indicators,moving averages,SMA,DMA,EMA,ADX,MACD,RSINaman In NAMAN_SM WideScreen charts, DMA,SMA,EMA technical analysis, forecast prediction, by indicators ADX,MACD,RSI,CCI NSE stock exchange
Daily price and charts and targets NamanIn Strong Daily Stock price targets for NamanIn NAMAN_SM are 83.98 and 85.93 | Daily Target 1 | 82.35 | | Daily Target 2 | 83.65 | | Daily Target 3 | 84.3 | | Daily Target 4 | 85.6 | | Daily Target 5 | 86.25 |
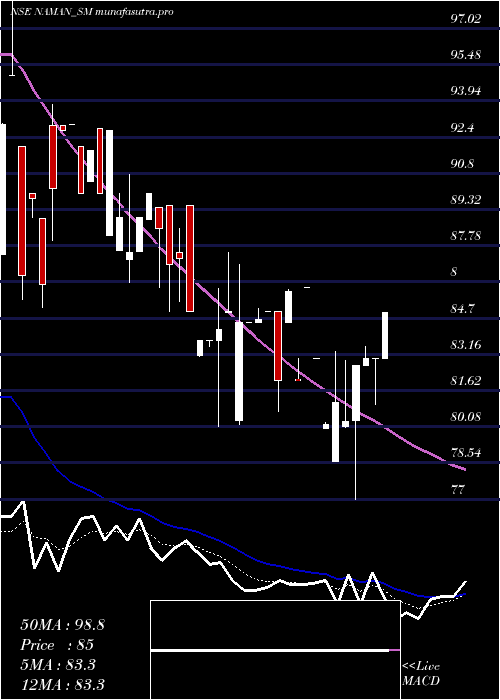
Daily price and volume Naman In
| Date |
Closing |
Open |
Range |
Volume |
Wed 29 October 2025 |
84.95 (2.35%) |
83.00 |
83.00 - 84.95 |
0.4 times |
Tue 28 October 2025 |
83.00 (0%) |
83.00 |
81.05 - 83.00 |
1.3333 times |
Mon 27 October 2025 |
83.00 (0.36%) |
82.70 |
82.70 - 83.50 |
0.6667 times |
Fri 24 October 2025 |
82.70 (2.99%) |
80.35 |
77.00 - 82.70 |
3.2 times |
Thu 23 October 2025 |
80.30 (-0.99%) |
80.10 |
80.05 - 82.90 |
1.6 times |
Tue 21 October 2025 |
81.10 (1.12%) |
78.60 |
78.60 - 83.30 |
0.9333 times |
Mon 20 October 2025 |
80.20 (-3.37%) |
80.00 |
80.00 - 80.25 |
0.6667 times |
Fri 17 October 2025 |
83.00 (-3.49%) |
83.00 |
83.00 - 83.00 |
0.2667 times |
Thu 16 October 2025 |
86.00 (4.81%) |
86.00 |
86.00 - 86.00 |
0.1333 times |
Wed 15 October 2025 |
82.05 (-4.43%) |
82.10 |
82.05 - 83.00 |
0.8 times |
Mon 13 October 2025 |
85.85 (4.63%) |
84.50 |
84.50 - 85.90 |
0.4 times |
Weekly price and charts NamanIn Strong weekly Stock price targets for NamanIn NAMAN_SM are 83 and 86.9 | Weekly Target 1 | 79.75 | | Weekly Target 2 | 82.35 | | Weekly Target 3 | 83.65 | | Weekly Target 4 | 86.25 | | Weekly Target 5 | 87.55 |
Weekly price and volumes for Naman In
| Date |
Closing |
Open |
Range |
Volume |
Wed 29 October 2025 |
84.95 (2.72%) |
82.70 |
81.05 - 84.95 |
0.4337 times |
Fri 24 October 2025 |
82.70 (-0.36%) |
80.00 |
77.00 - 83.30 |
1.1566 times |
Fri 17 October 2025 |
83.00 (1.16%) |
84.50 |
82.05 - 86.00 |
0.2892 times |
Fri 10 October 2025 |
82.05 (-3.47%) |
80.35 |
80.20 - 87.00 |
1.9518 times |
Fri 03 October 2025 |
85.00 (0%) |
83.10 |
80.10 - 87.50 |
0.6747 times |
Fri 26 September 2025 |
85.00 (-4.49%) |
88.90 |
85.00 - 90.00 |
1.5904 times |
Fri 19 September 2025 |
89.00 (-3.1%) |
92.75 |
86.20 - 92.75 |
1.0843 times |
Fri 12 September 2025 |
91.85 (6.62%) |
92.90 |
88.00 - 93.80 |
0.6747 times |
Fri 05 September 2025 |
86.15 (-0.98%) |
87.40 |
85.15 - 99.90 |
2 times |
Fri 29 August 2025 |
87.00 (-7.79%) |
88.90 |
85.70 - 88.90 |
0.1446 times |
Fri 22 August 2025 |
94.35 (-50.28%) |
91.65 |
85.00 - 95.55 |
1.0361 times |

Monthly price and charts NamanIn Strong monthly Stock price targets for NamanIn NAMAN_SM are 80.98 and 91.48 | Monthly Target 1 | 72.65 | | Monthly Target 2 | 78.8 | | Monthly Target 3 | 83.15 | | Monthly Target 4 | 89.3 | | Monthly Target 5 | 93.65 |
Monthly price and volumes Naman In
| Date |
Closing |
Open |
Range |
Volume |
Wed 29 October 2025 |
84.95 (1.43%) |
83.75 |
77.00 - 87.50 |
0.1052 times |
Tue 30 September 2025 |
83.75 (-3.74%) |
87.40 |
83.05 - 99.90 |
0.1378 times |
Fri 29 August 2025 |
87.00 (-54.15%) |
91.65 |
85.00 - 95.55 |
0.0291 times |
Tue 08 October 2024 |
189.75 (6.57%) |
180.00 |
174.05 - 194.90 |
0.1141 times |
Mon 30 September 2024 |
178.05 (-13.36%) |
203.45 |
178.00 - 216.00 |
0.5585 times |
Fri 30 August 2024 |
205.50 (48.38%) |
138.50 |
130.50 - 257.00 |
3.0137 times |
Wed 31 July 2024 |
138.50 (40.25%) |
97.05 |
93.85 - 149.30 |
2.0677 times |
Fri 28 June 2024 |
98.75 (8.52%) |
92.70 |
80.00 - 112.30 |
0.7712 times |
Fri 31 May 2024 |
91.00 (-23.08%) |
122.00 |
88.00 - 128.00 |
1.3036 times |
Tue 30 April 2024 |
118.30 (0%) |
133.00 |
114.00 - 146.00 |
1.899 times |
Wed 29 October 2025 |
(0%) |
|
- |
0 times |

DMA SMA EMA moving averages of Naman In NAMAN_SM
DMA (daily moving average) of Naman In NAMAN_SM
| DMA period | DMA value | | 5 day DMA | 82.79 | | 12 day DMA | 82.85 | | 20 day DMA | 83.48 | | 35 day DMA | 86.09 | | 50 day DMA | 89.18 | | 100 day DMA | 137.18 | | 150 day DMA | 127.63 | | 200 day DMA | | EMA (exponential moving average) of Naman In NAMAN_SM
| EMA period | EMA current | EMA prev | EMA prev2 | | 5 day EMA | 83.34 | 82.53 | 82.29 | | 12 day EMA | 83.3 | 83 | 83 | | 20 day EMA | 84.78 | 84.76 | 84.95 | | 35 day EMA | 90.37 | 90.69 | 91.14 | | 50 day EMA | 96.05 | 96.5 | 97.05 |
SMA (simple moving average) of Naman In NAMAN_SM
| SMA period | SMA current | SMA prev | SMA prev2 | | 5 day SMA | 82.79 | 82.02 | 81.46 | | 12 day SMA | 82.85 | 82.85 | 82.99 | | 20 day SMA | 83.48 | 83.48 | 83.69 | | 35 day SMA | 86.09 | 86.13 | 86.32 | | 50 day SMA | 89.18 | 91.21 | 93.18 | | 100 day SMA | 137.18 | 137.56 | 137.98 | | 150 day SMA | 127.63 | 127.85 | 128.04 | | 200 day SMA |
|
|
