NipponL NAM-INDIA full analysis,charts,indicators,moving averages,SMA,DMA,EMA,ADX,MACD,RSINippon L NAM-INDIA WideScreen charts, DMA,SMA,EMA technical analysis, forecast prediction, by indicators ADX,MACD,RSI,CCI NSE stock exchange
Daily price and charts and targets NipponL Strong Daily Stock price targets for NipponL NAM-INDIA are 883.7 and 916.75 | Daily Target 1 | 876.62 | | Daily Target 2 | 890.78 | | Daily Target 3 | 909.66666666667 | | Daily Target 4 | 923.83 | | Daily Target 5 | 942.72 |
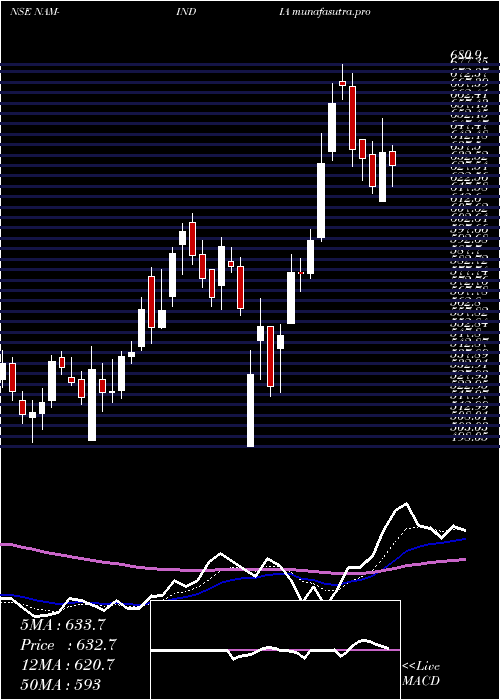
Daily price and volume Nippon L
| Date |
Closing |
Open |
Range |
Volume |
Tue 28 October 2025 |
904.95 (-1.17%) |
922.00 |
895.50 - 928.55 |
0.6569 times |
Mon 27 October 2025 |
915.65 (-0.77%) |
922.75 |
913.30 - 944.10 |
1.2428 times |
Fri 24 October 2025 |
922.75 (-1.91%) |
946.45 |
917.00 - 949.30 |
0.5086 times |
Thu 23 October 2025 |
940.75 (-2.84%) |
973.80 |
934.15 - 987.35 |
1.3222 times |
Tue 21 October 2025 |
968.20 (1.8%) |
951.40 |
947.05 - 971.90 |
0.3014 times |
Mon 20 October 2025 |
951.05 (4.13%) |
920.65 |
915.00 - 956.80 |
1.1712 times |
Fri 17 October 2025 |
913.30 (2.94%) |
887.20 |
887.00 - 939.00 |
1.8663 times |
Thu 16 October 2025 |
887.20 (-1.27%) |
910.00 |
885.15 - 910.00 |
0.8378 times |
Wed 15 October 2025 |
898.60 (2.13%) |
879.80 |
870.10 - 910.00 |
0.8651 times |
Tue 14 October 2025 |
879.85 (-0.53%) |
884.65 |
875.00 - 911.00 |
1.2277 times |
Mon 13 October 2025 |
884.55 (1.46%) |
865.00 |
860.45 - 907.00 |
1.681 times |
Weekly price and charts NipponL Strong weekly Stock price targets for NipponL NAM-INDIA are 875.93 and 924.53 | Weekly Target 1 | 866.25 | | Weekly Target 2 | 885.6 | | Weekly Target 3 | 914.85 | | Weekly Target 4 | 934.2 | | Weekly Target 5 | 963.45 |
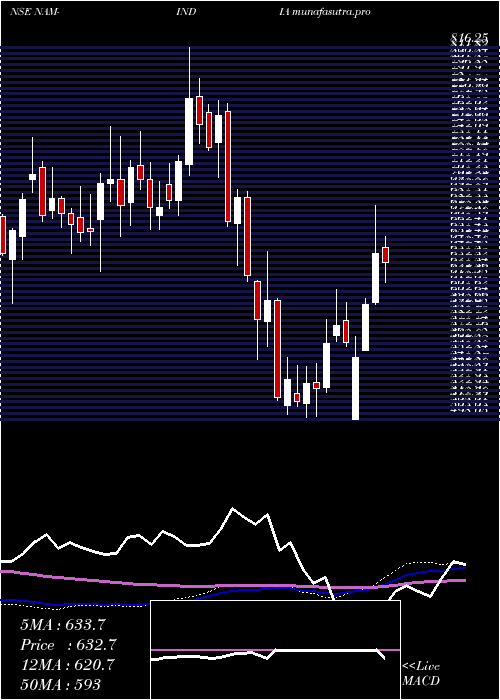
Weekly price and volumes for Nippon L
| Date |
Closing |
Open |
Range |
Volume |
Tue 28 October 2025 |
904.95 (-1.93%) |
922.75 |
895.50 - 944.10 |
0.4277 times |
Fri 24 October 2025 |
922.75 (1.03%) |
920.65 |
915.00 - 987.35 |
0.7437 times |
Fri 17 October 2025 |
913.30 (4.75%) |
865.00 |
860.45 - 939.00 |
1.4584 times |
Fri 10 October 2025 |
871.85 (-1.72%) |
895.80 |
850.10 - 903.70 |
1.2445 times |
Fri 03 October 2025 |
887.10 (3.65%) |
855.00 |
853.65 - 897.90 |
1.3539 times |
Fri 26 September 2025 |
855.90 (2.53%) |
836.90 |
833.05 - 861.00 |
1.2318 times |
Fri 19 September 2025 |
834.80 (0.85%) |
829.95 |
823.00 - 856.55 |
0.7467 times |
Fri 12 September 2025 |
827.75 (3.72%) |
806.65 |
794.00 - 843.20 |
1.0149 times |
Fri 05 September 2025 |
798.05 (1.69%) |
792.40 |
785.45 - 829.85 |
0.9093 times |
Fri 29 August 2025 |
784.75 (-9.26%) |
866.00 |
780.25 - 870.15 |
0.8691 times |
Fri 22 August 2025 |
864.85 (7.49%) |
806.95 |
806.95 - 887.90 |
1.574 times |
Monthly price and charts NipponL Strong monthly Stock price targets for NipponL NAM-INDIA are 877.53 and 1014.78 | Monthly Target 1 | 776.88 | | Monthly Target 2 | 840.92 | | Monthly Target 3 | 914.13333333333 | | Monthly Target 4 | 978.17 | | Monthly Target 5 | 1051.38 |
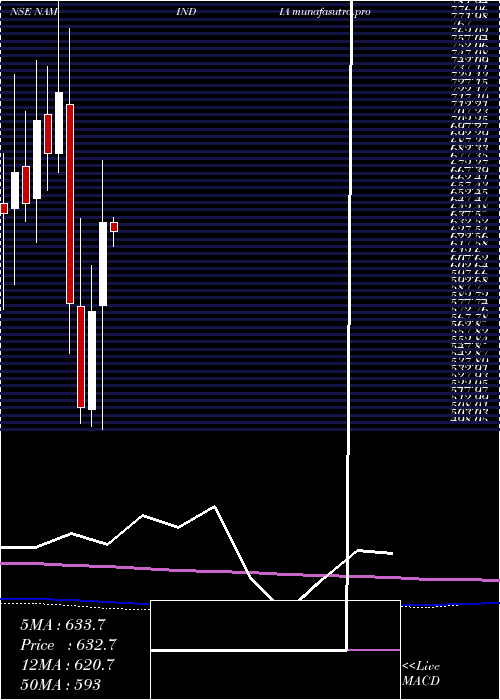
Monthly price and volumes Nippon L
| Date |
Closing |
Open |
Range |
Volume |
Tue 28 October 2025 |
904.95 (4.21%) |
864.50 |
850.10 - 987.35 |
0.8007 times |
Tue 30 September 2025 |
868.35 (10.65%) |
792.40 |
785.45 - 880.95 |
0.8351 times |
Fri 29 August 2025 |
784.75 (-3.4%) |
814.00 |
780.25 - 887.90 |
0.7347 times |
Thu 31 July 2025 |
812.35 (1.54%) |
804.80 |
772.15 - 876.70 |
1.0149 times |
Mon 30 June 2025 |
800.05 (7.98%) |
743.95 |
714.05 - 821.95 |
1.088 times |
Fri 30 May 2025 |
740.95 (16.01%) |
639.00 |
613.00 - 758.10 |
0.8936 times |
Wed 30 April 2025 |
638.70 (10.4%) |
582.55 |
498.05 - 680.90 |
1.214 times |
Fri 28 March 2025 |
578.55 (12.71%) |
512.00 |
499.95 - 609.75 |
1.1323 times |
Fri 28 February 2025 |
513.30 (-12.08%) |
582.00 |
502.10 - 641.55 |
1.0418 times |
Fri 31 January 2025 |
583.80 (-19.7%) |
718.80 |
549.75 - 770.90 |
1.2449 times |
Tue 31 December 2024 |
727.00 (6.05%) |
685.45 |
673.00 - 816.25 |
1.5201 times |
DMA SMA EMA moving averages of Nippon L NAM-INDIA
DMA (daily moving average) of Nippon L NAM-INDIA
| DMA period | DMA value | | 5 day DMA | 930.46 | | 12 day DMA | 911.56 | | 20 day DMA | 895.34 | | 35 day DMA | 868.99 | | 50 day DMA | 855.43 | | 100 day DMA | 827.04 | | 150 day DMA | 766.46 | | 200 day DMA | 722.09 | EMA (exponential moving average) of Nippon L NAM-INDIA
| EMA period | EMA current | EMA prev | EMA prev2 | | 5 day EMA | 918.74 | 925.63 | 930.62 | | 12 day EMA | 910.97 | 912.06 | 911.41 | | 20 day EMA | 897.84 | 897.09 | 895.14 | | 35 day EMA | 877.98 | 876.39 | 874.08 | | 50 day EMA | 858.37 | 856.47 | 854.06 |
SMA (simple moving average) of Nippon L NAM-INDIA
| SMA period | SMA current | SMA prev | SMA prev2 | | 5 day SMA | 930.46 | 939.68 | 939.21 | | 12 day SMA | 911.56 | 907.62 | 903.06 | | 20 day SMA | 895.34 | 892.88 | 890.02 | | 35 day SMA | 868.99 | 865.93 | 862.97 | | 50 day SMA | 855.43 | 853.32 | 850.99 | | 100 day SMA | 827.04 | 825.47 | 823.64 | | 150 day SMA | 766.46 | 764.03 | 761.43 | | 200 day SMA | 722.09 | 721.36 | 720.55 |
|
|
