NaharPoly NAHARPOLY full analysis,charts,indicators,moving averages,SMA,DMA,EMA,ADX,MACD,RSINahar Poly NAHARPOLY WideScreen charts, DMA,SMA,EMA technical analysis, forecast prediction, by indicators ADX,MACD,RSI,CCI NSE stock exchange
operates under Textiles sector
Daily price and charts and targets NaharPoly Strong Daily Stock price targets for NaharPoly NAHARPOLY are 288.45 and 294.85 | Daily Target 1 | 287.2 | | Daily Target 2 | 289.7 | | Daily Target 3 | 293.6 | | Daily Target 4 | 296.1 | | Daily Target 5 | 300 |
Daily price and volume Nahar Poly
| Date |
Closing |
Open |
Range |
Volume |
Wed 29 October 2025 |
292.20 (-0.71%) |
293.00 |
291.10 - 297.50 |
1.3229 times |
Tue 28 October 2025 |
294.30 (-0.27%) |
293.50 |
291.35 - 300.00 |
0.6881 times |
Mon 27 October 2025 |
295.10 (-0.97%) |
306.00 |
293.80 - 306.25 |
0.8427 times |
Fri 24 October 2025 |
298.00 (-1.41%) |
300.75 |
297.00 - 303.80 |
0.5571 times |
Thu 23 October 2025 |
302.25 (0.03%) |
299.00 |
295.80 - 307.00 |
1.1934 times |
Tue 21 October 2025 |
302.15 (1.14%) |
308.00 |
298.00 - 309.70 |
0.5064 times |
Mon 20 October 2025 |
298.75 (0.59%) |
295.00 |
295.00 - 308.00 |
1.197 times |
Fri 17 October 2025 |
297.00 (0%) |
297.50 |
292.50 - 305.00 |
1.3242 times |
Thu 16 October 2025 |
297.00 (-2.65%) |
303.00 |
290.40 - 310.50 |
1.5302 times |
Wed 15 October 2025 |
305.10 (0.23%) |
305.00 |
301.55 - 310.00 |
0.838 times |
Tue 14 October 2025 |
304.40 (-1.65%) |
309.50 |
303.10 - 315.90 |
0.7291 times |
Weekly price and charts NaharPoly Strong weekly Stock price targets for NaharPoly NAHARPOLY are 284.08 and 299.23 | Weekly Target 1 | 281.37 | | Weekly Target 2 | 286.78 | | Weekly Target 3 | 296.51666666667 | | Weekly Target 4 | 301.93 | | Weekly Target 5 | 311.67 |
Weekly price and volumes for Nahar Poly
| Date |
Closing |
Open |
Range |
Volume |
Wed 29 October 2025 |
292.20 (-1.95%) |
306.00 |
291.10 - 306.25 |
0.1794 times |
Fri 24 October 2025 |
298.00 (0.34%) |
295.00 |
295.00 - 309.70 |
0.2171 times |
Fri 17 October 2025 |
297.00 (-5.43%) |
317.80 |
290.40 - 324.00 |
0.3488 times |
Fri 10 October 2025 |
314.05 (6.12%) |
295.95 |
292.55 - 338.80 |
0.6712 times |
Fri 03 October 2025 |
295.95 (2.67%) |
304.95 |
284.05 - 304.95 |
0.2512 times |
Fri 26 September 2025 |
288.25 (-0.71%) |
290.30 |
285.00 - 324.90 |
0.5989 times |
Fri 19 September 2025 |
290.30 (0.02%) |
290.25 |
284.60 - 294.80 |
0.1539 times |
Fri 12 September 2025 |
290.25 (-2.44%) |
293.10 |
287.05 - 298.80 |
0.2109 times |
Fri 05 September 2025 |
297.50 (-7.61%) |
298.80 |
293.05 - 310.00 |
0.3932 times |
Wed 28 May 2025 |
322.00 (7.6%) |
297.76 |
289.85 - 367.32 |
6.9753 times |
Fri 23 May 2025 |
299.25 (34.37%) |
222.65 |
218.00 - 309.00 |
4.4279 times |
Monthly price and charts NaharPoly Strong monthly Stock price targets for NaharPoly NAHARPOLY are 288.6 and 342.4 | Monthly Target 1 | 251.53 | | Monthly Target 2 | 271.87 | | Monthly Target 3 | 305.33333333333 | | Monthly Target 4 | 325.67 | | Monthly Target 5 | 359.13 |
Monthly price and volumes Nahar Poly
| Date |
Closing |
Open |
Range |
Volume |
Wed 29 October 2025 |
292.20 (2.45%) |
291.95 |
285.00 - 338.80 |
0.4171 times |
Tue 30 September 2025 |
285.20 (-11.43%) |
298.80 |
284.05 - 324.90 |
0.3814 times |
Wed 28 May 2025 |
322.00 (57.1%) |
205.00 |
192.99 - 367.32 |
3.1826 times |
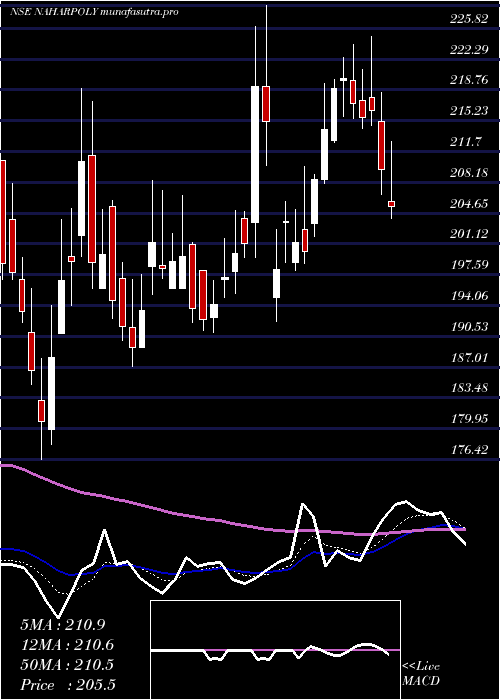
Wed 30 April 2025 |
204.97 (3.94%) |
197.95 |
192.20 - 228.38 |
0.3485 times |
Fri 28 March 2025 |
197.20 (5.68%) |
183.20 |
176.42 - 218.88 |
0.4879 times |
Fri 28 February 2025 |
186.60 (-17.18%) |
229.00 |
185.02 - 234.40 |
0.5003 times |
Fri 31 January 2025 |
225.30 (-13.61%) |
262.00 |
210.00 - 280.95 |
0.5283 times |
Tue 31 December 2024 |
260.80 (-5.95%) |
283.45 |
255.35 - 353.95 |
1.9432 times |
Fri 29 November 2024 |
277.29 (-14.06%) |
267.49 |
250.01 - 291.45 |
0.3924 times |
Tue 13 August 2024 |
322.65 (-0.24%) |
324.95 |
285.05 - 372.00 |
1.8182 times |
Wed 31 July 2024 |
323.43 (33.44%) |
246.07 |
246.07 - 334.89 |
4.5701 times |
DMA SMA EMA moving averages of Nahar Poly NAHARPOLY
DMA (daily moving average) of Nahar Poly NAHARPOLY
| DMA period | DMA value | | 5 day DMA | 296.37 | | 12 day DMA | 299.65 | | 20 day DMA | 300.69 | | 35 day DMA | 297.38 | | 50 day DMA | 293.16 | | 100 day DMA | 248.27 | | 150 day DMA | 244.87 | | 200 day DMA | 257.33 | EMA (exponential moving average) of Nahar Poly NAHARPOLY
| EMA period | EMA current | EMA prev | EMA prev2 | | 5 day EMA | 295.49 | 297.13 | 298.55 | | 12 day EMA | 298.17 | 299.26 | 300.16 | | 20 day EMA | 297.89 | 298.49 | 298.93 | | 35 day EMA | 292.99 | 293.04 | 292.97 | | 50 day EMA | 287.1 | 286.89 | 286.59 |
SMA (simple moving average) of Nahar Poly NAHARPOLY
| SMA period | SMA current | SMA prev | SMA prev2 | | 5 day SMA | 296.37 | 298.36 | 299.25 | | 12 day SMA | 299.65 | 301.47 | 302.52 | | 20 day SMA | 300.69 | 300.75 | 300.45 | | 35 day SMA | 297.38 | 297.33 | 297.42 | | 50 day SMA | 293.16 | 291.79 | 290.29 | | 100 day SMA | 248.27 | 247.32 | 246.37 | | 150 day SMA | 244.87 | 244.95 | 244.94 | | 200 day SMA | 257.33 | 257.32 | 257.06 |
|
|
