NaharCapital NAHARCAP full analysis,charts,indicators,moving averages,SMA,DMA,EMA,ADX,MACD,RSINahar Capital NAHARCAP WideScreen charts, DMA,SMA,EMA technical analysis, forecast prediction, by indicators ADX,MACD,RSI,CCI NSE stock exchange
operates under Investment Companies sector
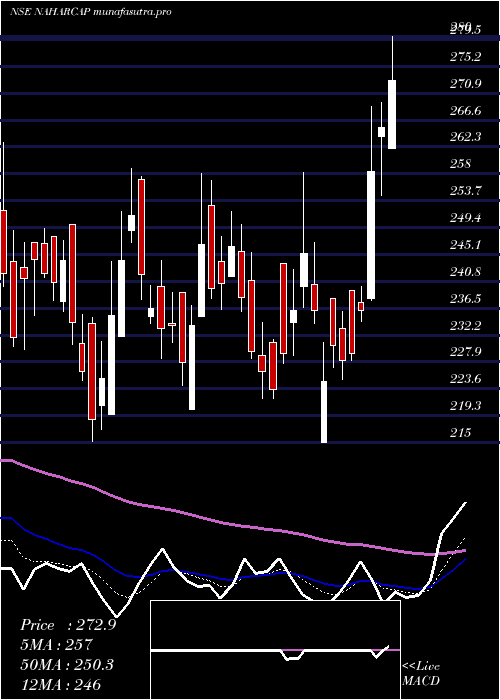
Daily price and charts and targets NaharCapital Strong Daily Stock price targets for NaharCapital NAHARCAP are 284.43 and 291.73 | Daily Target 1 | 283.03 | | Daily Target 2 | 285.82 | | Daily Target 3 | 290.33333333333 | | Daily Target 4 | 293.12 | | Daily Target 5 | 297.63 |
Daily price and volume Nahar Capital
| Date |
Closing |
Open |
Range |
Volume |
Tue 28 October 2025 |
288.60 (-1.32%) |
293.95 |
287.55 - 294.85 |
0.4666 times |
Mon 27 October 2025 |
292.45 (1.3%) |
289.00 |
289.00 - 299.90 |
2.4313 times |
Fri 24 October 2025 |
288.70 (-0.17%) |
287.80 |
285.60 - 289.00 |
0.6589 times |
Thu 23 October 2025 |
289.20 (2.9%) |
281.05 |
281.05 - 290.70 |
0.8748 times |
Tue 21 October 2025 |
281.05 (-0.18%) |
280.20 |
280.20 - 286.00 |
0.318 times |
Mon 20 October 2025 |
281.55 (-0.05%) |
280.25 |
280.25 - 287.05 |
0.3617 times |
Fri 17 October 2025 |
281.70 (0.82%) |
286.90 |
279.00 - 286.90 |
1.3564 times |
Thu 16 October 2025 |
279.40 (-0.14%) |
287.90 |
278.05 - 287.90 |
0.9263 times |
Wed 15 October 2025 |
279.80 (0.29%) |
281.00 |
279.35 - 287.90 |
0.6708 times |
Tue 14 October 2025 |
279.00 (-2.77%) |
286.70 |
278.00 - 286.80 |
1.9352 times |
Mon 13 October 2025 |
286.95 (0.38%) |
285.55 |
283.20 - 292.40 |
0.8345 times |
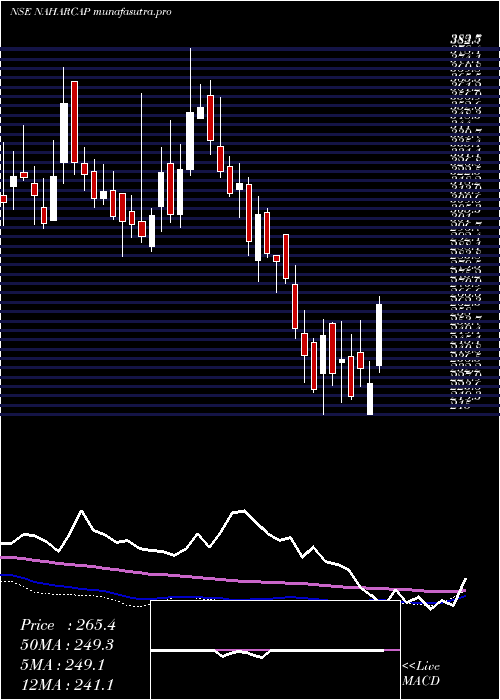
Weekly price and charts NaharCapital Strong weekly Stock price targets for NaharCapital NAHARCAP are 281.9 and 294.25 | Weekly Target 1 | 279.67 | | Weekly Target 2 | 284.13 | | Weekly Target 3 | 292.01666666667 | | Weekly Target 4 | 296.48 | | Weekly Target 5 | 304.37 |
Weekly price and volumes for Nahar Capital
| Date |
Closing |
Open |
Range |
Volume |
Tue 28 October 2025 |
288.60 (-0.03%) |
289.00 |
287.55 - 299.90 |
0.0902 times |
Fri 24 October 2025 |
288.70 (2.48%) |
280.25 |
280.20 - 290.70 |
0.0689 times |
Fri 17 October 2025 |
281.70 (-1.45%) |
285.55 |
278.00 - 292.40 |
0.1782 times |
Fri 10 October 2025 |
285.85 (-13.48%) |
300.00 |
285.00 - 307.00 |
0.4473 times |
Wed 02 July 2025 |
330.40 (-0.35%) |
334.90 |
326.10 - 354.25 |
0.3838 times |
Fri 27 June 2025 |
331.55 (3.82%) |
324.75 |
309.00 - 338.00 |
0.5129 times |
Fri 20 June 2025 |
319.35 (-4.63%) |
332.00 |
312.50 - 344.25 |
0.8844 times |
Fri 13 June 2025 |
334.85 (10.24%) |
299.20 |
299.20 - 376.65 |
5.1476 times |
Fri 06 June 2025 |
303.75 (5.45%) |
289.00 |
287.70 - 306.65 |
0.6966 times |
Fri 30 May 2025 |
288.05 (0.68%) |
290.00 |
286.00 - 305.00 |
1.5899 times |
Fri 23 May 2025 |
286.10 (4.93%) |
271.30 |
266.90 - 297.95 |
0.7381 times |
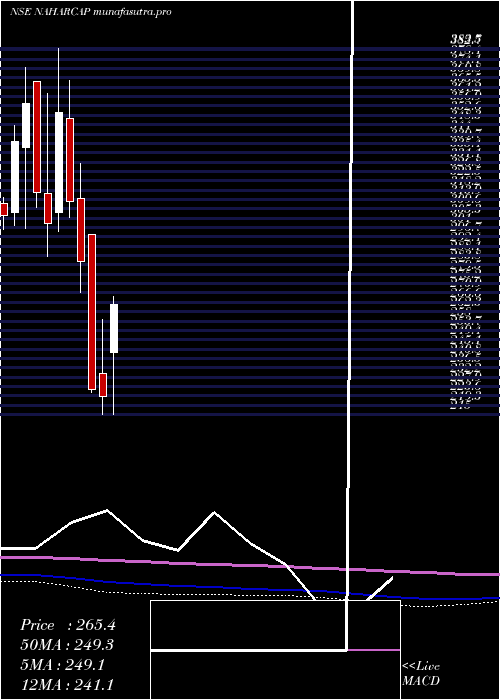
Monthly price and charts NaharCapital Strong monthly Stock price targets for NaharCapital NAHARCAP are 268.8 and 297.8 | Monthly Target 1 | 262.2 | | Monthly Target 2 | 275.4 | | Monthly Target 3 | 291.2 | | Monthly Target 4 | 304.4 | | Monthly Target 5 | 320.2 |
Monthly price and volumes Nahar Capital
| Date |
Closing |
Open |
Range |
Volume |
Tue 28 October 2025 |
288.60 (-12.65%) |
300.00 |
278.00 - 307.00 |
0.2775 times |
Wed 02 July 2025 |
330.40 (-2.99%) |
340.00 |
327.35 - 354.25 |
0.0826 times |
Mon 30 June 2025 |
340.60 (18.24%) |
289.00 |
287.70 - 376.65 |
2.6145 times |
Fri 30 May 2025 |
288.05 (14.84%) |
253.80 |
241.25 - 305.00 |
1.196 times |
Wed 30 April 2025 |
250.82 (12.24%) |
243.59 |
215.00 - 280.00 |
0.5949 times |
Fri 28 March 2025 |
223.47 (-1.27%) |
234.00 |
215.10 - 258.82 |
0.6502 times |
Fri 28 February 2025 |
226.35 (-20.65%) |
297.75 |
225.00 - 297.75 |
0.561 times |
Fri 31 January 2025 |
285.25 (-8.81%) |
314.30 |
271.10 - 330.30 |
0.7506 times |
Tue 31 December 2024 |
312.80 (-11.6%) |
350.90 |
305.60 - 368.80 |
1.1486 times |
Fri 29 November 2024 |
353.85 (16.86%) |
308.00 |
299.05 - 383.50 |
2.124 times |
Thu 31 October 2024 |
302.80 (-4.55%) |
316.85 |
287.50 - 362.60 |
2.0663 times |
DMA SMA EMA moving averages of Nahar Capital NAHARCAP
DMA (daily moving average) of Nahar Capital NAHARCAP
| DMA period | DMA value | | 5 day DMA | 288 | | 12 day DMA | 284.52 | | 20 day DMA | 295.56 | | 35 day DMA | 309.46 | | 50 day DMA | 302.65 | | 100 day DMA | 273.38 | | 150 day DMA | 278.46 | | 200 day DMA | 289.44 | EMA (exponential moving average) of Nahar Capital NAHARCAP
| EMA period | EMA current | EMA prev | EMA prev2 | | 5 day EMA | 288.19 | 287.98 | 285.75 | | 12 day EMA | 289.28 | 289.4 | 288.84 | | 20 day EMA | 293.33 | 293.83 | 293.98 | | 35 day EMA | 294.55 | 294.9 | 295.04 | | 50 day EMA | 297.83 | 298.21 | 298.44 |
SMA (simple moving average) of Nahar Capital NAHARCAP
| SMA period | SMA current | SMA prev | SMA prev2 | | 5 day SMA | 288 | 286.59 | 284.44 | | 12 day SMA | 284.52 | 284.24 | 283.81 | | 20 day SMA | 295.56 | 297.61 | 299.39 | | 35 day SMA | 309.46 | 309.74 | 309.69 | | 50 day SMA | 302.65 | 302.29 | 302.01 | | 100 day SMA | 273.38 | 272.93 | 272.42 | | 150 day SMA | 278.46 | 278.84 | 279.16 | | 200 day SMA | 289.44 | 289.55 | 289.66 |
|
|
