MV MVKAGRO_ST full analysis,charts,indicators,moving averages,SMA,DMA,EMA,ADX,MACD,RSIM V MVKAGRO_ST WideScreen charts, DMA,SMA,EMA technical analysis, forecast prediction, by indicators ADX,MACD,RSI,CCI NSE stock exchange
Daily price and charts and targets MV Strong Daily Stock price targets for MV MVKAGRO_ST are 545.9 and 545.9 | Daily Target 1 | 545.9 | | Daily Target 2 | 545.9 | | Daily Target 3 | 545.9 | | Daily Target 4 | 545.9 | | Daily Target 5 | 545.9 |
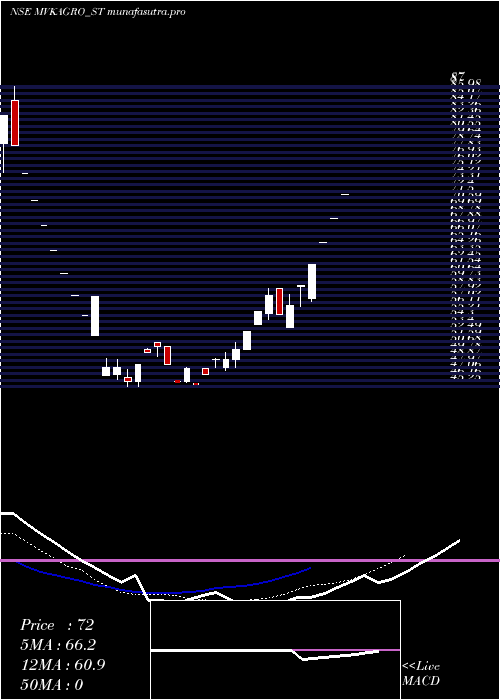
Daily price and volume M V
| Date |
Closing |
Open |
Range |
Volume |
Mon 27 October 2025 |
545.90 (-2%) |
545.90 |
545.90 - 545.90 |
0.0884 times |
Fri 24 October 2025 |
557.05 (-2%) |
557.05 |
557.05 - 557.05 |
0.0147 times |
Thu 23 October 2025 |
568.40 (-2%) |
568.40 |
568.40 - 568.40 |
0.1178 times |
Tue 21 October 2025 |
580.00 (0%) |
580.00 |
580.00 - 580.00 |
0.1031 times |
Mon 20 October 2025 |
580.00 (1.78%) |
571.95 |
558.45 - 580.00 |
3.137 times |
Fri 17 October 2025 |
569.85 (0%) |
569.85 |
569.85 - 574.00 |
0.1767 times |
Thu 16 October 2025 |
569.85 (2%) |
569.85 |
566.00 - 569.85 |
0.4418 times |
Wed 15 October 2025 |
558.70 (2%) |
547.75 |
547.75 - 558.70 |
1.3549 times |
Tue 14 October 2025 |
547.75 (1.99%) |
526.30 |
526.30 - 547.75 |
3.2842 times |
Mon 13 October 2025 |
537.05 (-2%) |
537.05 |
537.05 - 537.05 |
1.2813 times |
Fri 10 October 2025 |
548.00 (-0.35%) |
554.95 |
546.75 - 555.00 |
0.648 times |
Weekly price and charts MV Strong weekly Stock price targets for MV MVKAGRO_ST are 545.9 and 545.9 | Weekly Target 1 | 545.9 | | Weekly Target 2 | 545.9 | | Weekly Target 3 | 545.9 | | Weekly Target 4 | 545.9 | | Weekly Target 5 | 545.9 |
Weekly price and volumes for M V
| Date |
Closing |
Open |
Range |
Volume |
Mon 27 October 2025 |
545.90 (-2%) |
545.90 |
545.90 - 545.90 |
0.016 times |
Fri 24 October 2025 |
557.05 (-2.25%) |
571.95 |
557.05 - 580.00 |
0.6107 times |
Fri 17 October 2025 |
569.85 (3.99%) |
537.05 |
526.30 - 574.00 |
1.184 times |
Fri 10 October 2025 |
548.00 (3.97%) |
537.55 |
516.50 - 555.70 |
1.3813 times |
Fri 03 October 2025 |
527.05 (8.21%) |
496.75 |
496.75 - 527.05 |
1.1627 times |
Fri 26 September 2025 |
487.05 (10.39%) |
450.00 |
432.40 - 487.05 |
0.4027 times |
Fri 19 September 2025 |
441.20 (10.37%) |
406.00 |
399.75 - 441.20 |
0.648 times |
Fri 12 September 2025 |
399.75 (8.04%) |
370.00 |
362.60 - 399.80 |
2.488 times |
Fri 05 September 2025 |
370.00 (8.11%) |
349.05 |
348.90 - 377.00 |
1.7653 times |
Fri 29 August 2025 |
342.25 (8.22%) |
322.55 |
322.55 - 342.25 |
0.3413 times |
Fri 22 August 2025 |
316.25 (10.13%) |
292.85 |
292.85 - 316.25 |
0.792 times |

Monthly price and charts MV Strong monthly Stock price targets for MV MVKAGRO_ST are 531.2 and 594.7 | Monthly Target 1 | 483.97 | | Monthly Target 2 | 514.93 | | Monthly Target 3 | 547.46666666667 | | Monthly Target 4 | 578.43 | | Monthly Target 5 | 610.97 |
Monthly price and volumes M V
| Date |
Closing |
Open |
Range |
Volume |
Mon 27 October 2025 |
545.90 (7.75%) |
516.50 |
516.50 - 580.00 |
1.0979 times |
Tue 30 September 2025 |
506.65 (48.04%) |
349.05 |
348.90 - 506.65 |
1.5286 times |
Fri 29 August 2025 |
342.25 (41.05%) |
247.50 |
247.50 - 342.25 |
1.9369 times |
Thu 31 July 2025 |
242.65 (57.21%) |
157.40 |
157.40 - 242.65 |
0.7418 times |
Mon 30 June 2025 |
154.35 (50.81%) |
104.35 |
104.35 - 154.35 |
0.9173 times |
Fri 30 May 2025 |
102.35 (64.42%) |
65.35 |
65.35 - 102.35 |
0.475 times |
Wed 30 April 2025 |
62.25 (35.18%) |
46.05 |
45.30 - 62.25 |
0.4061 times |
Fri 28 March 2025 |
46.05 (0%) |
79.00 |
45.25 - 87.00 |
0.8963 times |
Tue 28 October 2025 |
(0%) |
|
- |
0 times |

DMA SMA EMA moving averages of M V MVKAGRO_ST
DMA (daily moving average) of M V MVKAGRO_ST
| DMA period | DMA value | | 5 day DMA | 566.27 | | 12 day DMA | 559.37 | | 20 day DMA | 542.61 | | 35 day DMA | 489.38 | | 50 day DMA | 439.74 | | 100 day DMA | 310.7 | | 150 day DMA | 229.95 | | 200 day DMA | | EMA (exponential moving average) of M V MVKAGRO_ST
| EMA period | EMA current | EMA prev | EMA prev2 | | 5 day EMA | 559.17 | 565.8 | 570.18 | | 12 day EMA | 553 | 554.29 | 553.79 | | 20 day EMA | 533.31 | 531.99 | 529.35 | | 35 day EMA | 487.79 | 484.37 | 480.09 | | 50 day EMA | 437.91 | 433.5 | 428.46 |
SMA (simple moving average) of M V MVKAGRO_ST
| SMA period | SMA current | SMA prev | SMA prev2 | | 5 day SMA | 566.27 | 571.06 | 573.62 | | 12 day SMA | 559.37 | 559.29 | 557.49 | | 20 day SMA | 542.61 | 539.19 | 534.74 | | 35 day SMA | 489.38 | 484.37 | 478.83 | | 50 day SMA | 439.74 | 434.34 | 428.61 | | 100 day SMA | 310.7 | 306.3 | 301.77 | | 150 day SMA | 229.95 | 226.79 | 223.57 | | 200 day SMA |
|
|
