MuthootCapital MUTHOOTCAP full analysis,charts,indicators,moving averages,SMA,DMA,EMA,ADX,MACD,RSIMuthoot Capital MUTHOOTCAP WideScreen charts, DMA,SMA,EMA technical analysis, forecast prediction, by indicators ADX,MACD,RSI,CCI NSE stock exchange
operates under Finance (including NBFCs) sector
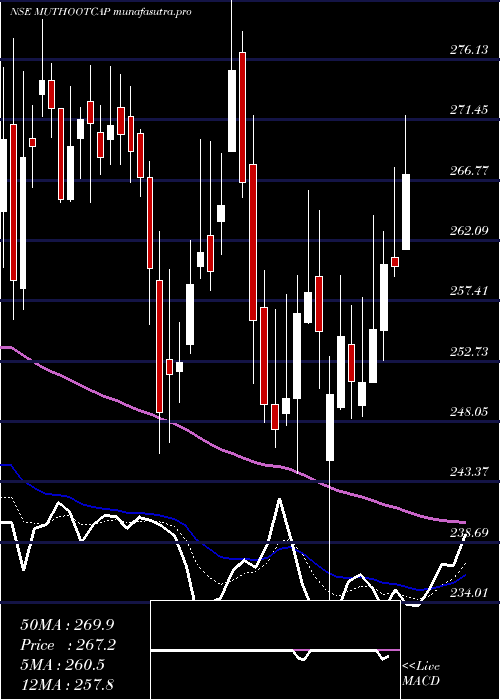
Daily price and charts and targets MuthootCapital Strong Daily Stock price targets for MuthootCapital MUTHOOTCAP are 282.05 and 310.65 | Daily Target 1 | 258.88 | | Daily Target 2 | 276.62 | | Daily Target 3 | 287.48333333333 | | Daily Target 4 | 305.22 | | Daily Target 5 | 316.08 |
Daily price and volume Muthoot Capital
| Date |
Closing |
Open |
Range |
Volume |
Tue 28 October 2025 |
294.35 (8.12%) |
269.90 |
269.75 - 298.35 |
3.5458 times |
Mon 27 October 2025 |
272.25 (7%) |
254.90 |
254.90 - 276.00 |
2.1312 times |
Fri 24 October 2025 |
254.45 (0.02%) |
255.40 |
253.00 - 256.00 |
0.2683 times |
Thu 23 October 2025 |
254.40 (1.31%) |
255.00 |
253.05 - 256.00 |
0.2418 times |
Tue 21 October 2025 |
251.10 (-1.66%) |
255.00 |
248.00 - 259.00 |
0.3125 times |
Mon 20 October 2025 |
255.35 (-0.93%) |
255.40 |
254.20 - 258.90 |
0.3742 times |
Fri 17 October 2025 |
257.75 (0.92%) |
258.00 |
255.20 - 264.70 |
0.5402 times |
Thu 16 October 2025 |
255.40 (-6.4%) |
273.00 |
248.90 - 273.10 |
2.3294 times |
Wed 15 October 2025 |
272.85 (0.31%) |
272.00 |
269.60 - 275.00 |
0.1047 times |
Tue 14 October 2025 |
272.00 (-0.6%) |
275.00 |
270.60 - 282.00 |
0.1519 times |
Mon 13 October 2025 |
273.65 (-0.35%) |
276.00 |
270.35 - 276.00 |
0.2863 times |
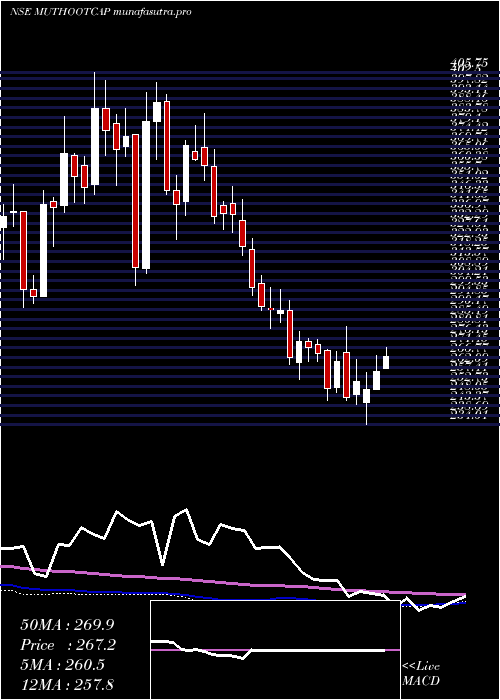
Weekly price and charts MuthootCapital Strong weekly Stock price targets for MuthootCapital MUTHOOTCAP are 274.63 and 318.08 | Weekly Target 1 | 239.08 | | Weekly Target 2 | 266.72 | | Weekly Target 3 | 282.53333333333 | | Weekly Target 4 | 310.17 | | Weekly Target 5 | 325.98 |
Weekly price and volumes for Muthoot Capital
| Date |
Closing |
Open |
Range |
Volume |
Tue 28 October 2025 |
294.35 (15.68%) |
254.90 |
254.90 - 298.35 |
3.6206 times |
Fri 24 October 2025 |
254.45 (-1.28%) |
255.40 |
248.00 - 259.00 |
0.7633 times |
Fri 17 October 2025 |
257.75 (-6.14%) |
276.00 |
248.90 - 282.00 |
2.1764 times |
Fri 10 October 2025 |
274.60 (-0.49%) |
274.75 |
268.95 - 281.40 |
0.5555 times |
Fri 03 October 2025 |
275.95 (-3.83%) |
281.00 |
274.40 - 286.95 |
0.3148 times |
Fri 26 September 2025 |
286.95 (1.95%) |
281.45 |
277.55 - 290.00 |
0.5414 times |
Fri 19 September 2025 |
281.45 (1.44%) |
278.90 |
270.00 - 289.45 |
0.7003 times |
Fri 12 September 2025 |
277.45 (0.4%) |
276.35 |
269.20 - 281.50 |
0.5711 times |
Fri 05 September 2025 |
276.35 (0.45%) |
275.10 |
273.05 - 285.95 |
0.4697 times |
Fri 29 August 2025 |
275.10 (-2.15%) |
282.00 |
271.45 - 282.70 |
0.2868 times |
Fri 22 August 2025 |
281.15 (3.76%) |
273.00 |
267.90 - 288.00 |
0.8263 times |
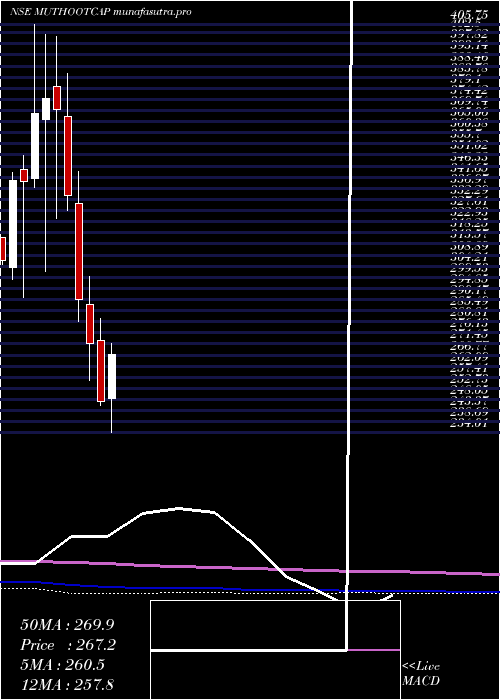
Monthly price and charts MuthootCapital Strong monthly Stock price targets for MuthootCapital MUTHOOTCAP are 271.18 and 321.53 | Monthly Target 1 | 229.88 | | Monthly Target 2 | 262.12 | | Monthly Target 3 | 280.23333333333 | | Monthly Target 4 | 312.47 | | Monthly Target 5 | 330.58 |
Monthly price and volumes Muthoot Capital
| Date |
Closing |
Open |
Range |
Volume |
Tue 28 October 2025 |
294.35 (5.62%) |
280.20 |
248.00 - 298.35 |
1.3498 times |
Tue 30 September 2025 |
278.70 (1.31%) |
275.10 |
269.20 - 290.00 |
0.4412 times |
Fri 29 August 2025 |
275.10 (-11.59%) |
310.80 |
265.00 - 313.00 |
0.9914 times |
Thu 31 July 2025 |
311.15 (-3.28%) |
321.70 |
305.00 - 366.30 |
1.1118 times |
Mon 30 June 2025 |
321.70 (12.86%) |
286.60 |
283.00 - 342.00 |
1.1312 times |
Fri 30 May 2025 |
285.05 (5.53%) |
267.70 |
261.10 - 297.00 |
1.116 times |
Wed 30 April 2025 |
270.12 (9.18%) |
248.69 |
234.01 - 289.00 |
1.6888 times |
Fri 28 March 2025 |
247.40 (-8.86%) |
272.90 |
245.60 - 282.10 |
0.8329 times |
Fri 28 February 2025 |
271.45 (-6.48%) |
288.25 |
255.95 - 300.00 |
0.5511 times |
Fri 31 January 2025 |
290.25 (-13.03%) |
330.70 |
281.05 - 344.00 |
0.786 times |
Tue 31 December 2024 |
333.75 (-9.8%) |
367.05 |
327.50 - 385.50 |
0.5538 times |
DMA SMA EMA moving averages of Muthoot Capital MUTHOOTCAP
DMA (daily moving average) of Muthoot Capital MUTHOOTCAP
| DMA period | DMA value | | 5 day DMA | 265.31 | | 12 day DMA | 265.68 | | 20 day DMA | 269.94 | | 35 day DMA | 274.2 | | 50 day DMA | 274.66 | | 100 day DMA | 294.63 | | 150 day DMA | 286.85 | | 200 day DMA | 286.08 | EMA (exponential moving average) of Muthoot Capital MUTHOOTCAP
| EMA period | EMA current | EMA prev | EMA prev2 | | 5 day EMA | 272.38 | 261.39 | 255.96 | | 12 day EMA | 268.39 | 263.67 | 262.11 | | 20 day EMA | 269.59 | 266.98 | 266.43 | | 35 day EMA | 271.24 | 269.88 | 269.74 | | 50 day EMA | 273.65 | 272.81 | 272.83 |
SMA (simple moving average) of Muthoot Capital MUTHOOTCAP
| SMA period | SMA current | SMA prev | SMA prev2 | | 5 day SMA | 265.31 | 257.51 | 254.61 | | 12 day SMA | 265.68 | 263.98 | 264.17 | | 20 day SMA | 269.94 | 269.57 | 269.99 | | 35 day SMA | 274.2 | 273.68 | 273.81 | | 50 day SMA | 274.66 | 274.14 | 274.11 | | 100 day SMA | 294.63 | 294.59 | 294.76 | | 150 day SMA | 286.85 | 286.63 | 286.54 | | 200 day SMA | 286.08 | 286.26 | 286.59 |
|
|
