MurudeshwarCeramics MURUDCERA full analysis,charts,indicators,moving averages,SMA,DMA,EMA,ADX,MACD,RSIMurudeshwar Ceramics MURUDCERA WideScreen charts, DMA,SMA,EMA technical analysis, forecast prediction, by indicators ADX,MACD,RSI,CCI NSE stock exchange
operates under Furniture-Furnishing-Paints sector
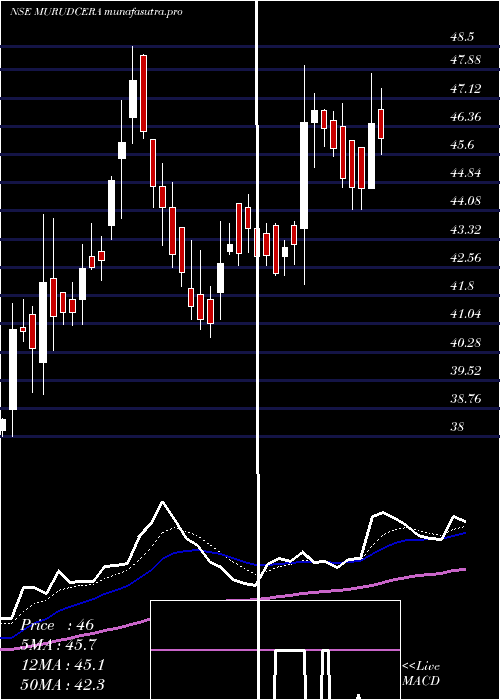
Daily price and charts and targets MurudeshwarCeramics Strong Daily Stock price targets for MurudeshwarCeramics MURUDCERA are 44.52 and 46.91 | Daily Target 1 | 42.62 | | Daily Target 2 | 44.03 | | Daily Target 3 | 45.013333333333 | | Daily Target 4 | 46.42 | | Daily Target 5 | 47.4 |
Daily price and volume Murudeshwar Ceramics
| Date |
Closing |
Open |
Range |
Volume |
Tue 28 October 2025 |
45.43 (0.26%) |
45.32 |
43.61 - 46.00 |
1.3648 times |
Mon 27 October 2025 |
45.31 (3.09%) |
43.95 |
43.95 - 45.95 |
0.8284 times |
Fri 24 October 2025 |
43.95 (-0.7%) |
44.27 |
43.50 - 45.24 |
1.2637 times |
Thu 23 October 2025 |
44.26 (1.51%) |
44.00 |
43.48 - 44.80 |
0.9979 times |
Tue 21 October 2025 |
43.60 (2.81%) |
42.90 |
41.86 - 44.37 |
0.9953 times |
Mon 20 October 2025 |
42.41 (2.12%) |
41.55 |
41.30 - 42.49 |
0.6512 times |
Fri 17 October 2025 |
41.53 (-0.98%) |
42.75 |
41.51 - 42.75 |
0.157 times |
Thu 16 October 2025 |
41.94 (0.31%) |
42.65 |
41.80 - 42.75 |
0.4587 times |
Wed 15 October 2025 |
41.81 (-1.34%) |
42.95 |
41.50 - 42.95 |
0.6311 times |
Tue 14 October 2025 |
42.38 (0.21%) |
41.66 |
41.30 - 44.75 |
2.6521 times |
Mon 13 October 2025 |
42.29 (0.88%) |
42.60 |
41.90 - 42.79 |
0.2384 times |
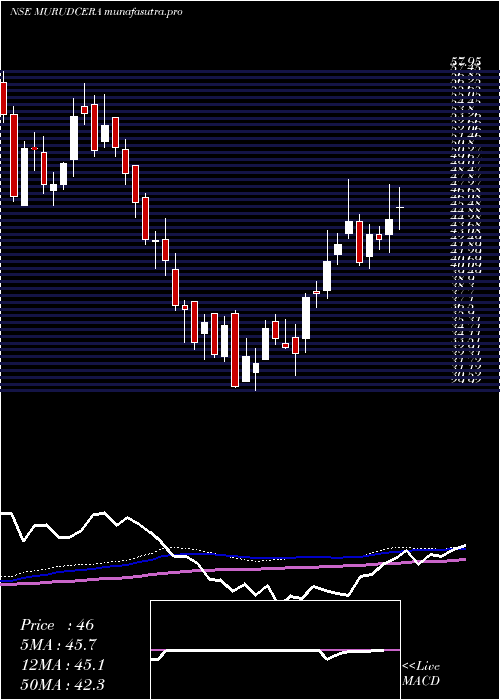
Weekly price and charts MurudeshwarCeramics Strong weekly Stock price targets for MurudeshwarCeramics MURUDCERA are 44.52 and 46.91 | Weekly Target 1 | 42.62 | | Weekly Target 2 | 44.03 | | Weekly Target 3 | 45.013333333333 | | Weekly Target 4 | 46.42 | | Weekly Target 5 | 47.4 |
Weekly price and volumes for Murudeshwar Ceramics
| Date |
Closing |
Open |
Range |
Volume |
Tue 28 October 2025 |
45.43 (3.37%) |
43.95 |
43.61 - 46.00 |
0.9264 times |
Fri 24 October 2025 |
43.95 (5.83%) |
41.55 |
41.30 - 45.24 |
1.6508 times |
Fri 17 October 2025 |
41.53 (-0.93%) |
42.60 |
41.30 - 44.75 |
1.7477 times |
Fri 10 October 2025 |
41.92 (-1.18%) |
43.00 |
41.03 - 43.60 |
1.0566 times |
Fri 03 October 2025 |
42.42 (2.64%) |
41.85 |
40.00 - 42.85 |
0.8548 times |
Fri 26 September 2025 |
41.33 (-5.03%) |
44.00 |
40.88 - 44.20 |
0.747 times |
Fri 19 September 2025 |
43.52 (-1.29%) |
44.75 |
43.40 - 45.99 |
0.6601 times |
Fri 12 September 2025 |
44.09 (2.23%) |
43.10 |
42.72 - 47.50 |
1.639 times |
Fri 05 September 2025 |
43.13 (1.05%) |
42.35 |
42.35 - 44.38 |
0.3704 times |
Fri 29 August 2025 |
42.68 (-3.33%) |
45.25 |
42.47 - 45.78 |
0.347 times |
Fri 22 August 2025 |
44.15 (5.88%) |
42.90 |
42.60 - 46.50 |
1.1331 times |
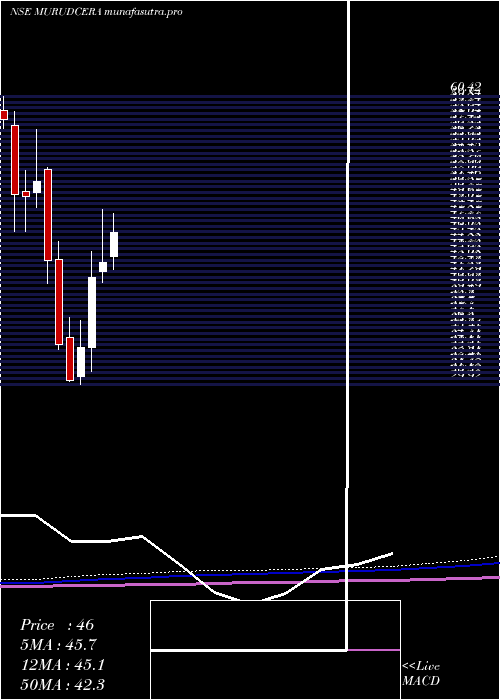
Monthly price and charts MurudeshwarCeramics Strong monthly Stock price targets for MurudeshwarCeramics MURUDCERA are 43.16 and 48.27 | Monthly Target 1 | 39 | | Monthly Target 2 | 42.21 | | Monthly Target 3 | 44.106666666667 | | Monthly Target 4 | 47.32 | | Monthly Target 5 | 49.22 |
Monthly price and volumes Murudeshwar Ceramics
| Date |
Closing |
Open |
Range |
Volume |
Tue 28 October 2025 |
45.43 (12.48%) |
41.00 |
40.89 - 46.00 |
1.0276 times |
Tue 30 September 2025 |
40.39 (-5.37%) |
42.35 |
40.00 - 47.50 |
0.6577 times |
Fri 29 August 2025 |
42.68 (-1.04%) |
43.54 |
41.57 - 46.99 |
0.8289 times |
Thu 31 July 2025 |
43.13 (0.63%) |
43.48 |
42.00 - 48.25 |
1.0642 times |
Mon 30 June 2025 |
42.86 (3.93%) |
41.90 |
40.68 - 48.50 |
1.3897 times |
Fri 30 May 2025 |
41.24 (22.01%) |
33.79 |
31.25 - 43.98 |
1.6815 times |
Wed 30 April 2025 |
33.80 (11.48%) |
30.70 |
29.92 - 36.65 |
0.7227 times |
Fri 28 March 2025 |
30.32 (-11.22%) |
34.92 |
30.20 - 37.00 |
1.1695 times |
Fri 28 February 2025 |
34.15 (-20.71%) |
43.19 |
33.55 - 45.06 |
0.5964 times |
Fri 31 January 2025 |
43.07 (-16.27%) |
52.75 |
40.62 - 52.90 |
0.8618 times |
Tue 31 December 2024 |
51.44 (3.23%) |
50.25 |
48.70 - 56.92 |
1.3089 times |
DMA SMA EMA moving averages of Murudeshwar Ceramics MURUDCERA
DMA (daily moving average) of Murudeshwar Ceramics MURUDCERA
| DMA period | DMA value | | 5 day DMA | 44.51 | | 12 day DMA | 43.07 | | 20 day DMA | 42.7 | | 35 day DMA | 43.11 | | 50 day DMA | 43.26 | | 100 day DMA | 43.66 | | 150 day DMA | 40.98 | | 200 day DMA | 40.77 | EMA (exponential moving average) of Murudeshwar Ceramics MURUDCERA
| EMA period | EMA current | EMA prev | EMA prev2 | | 5 day EMA | 44.5 | 44.04 | 43.4 | | 12 day EMA | 43.59 | 43.25 | 42.88 | | 20 day EMA | 43.25 | 43.02 | 42.78 | | 35 day EMA | 43.17 | 43.04 | 42.91 | | 50 day EMA | 43.38 | 43.3 | 43.22 |
SMA (simple moving average) of Murudeshwar Ceramics MURUDCERA
| SMA period | SMA current | SMA prev | SMA prev2 | | 5 day SMA | 44.51 | 43.91 | 43.15 | | 12 day SMA | 43.07 | 42.76 | 42.54 | | 20 day SMA | 42.7 | 42.5 | 42.34 | | 35 day SMA | 43.11 | 43.04 | 42.99 | | 50 day SMA | 43.26 | 43.22 | 43.16 | | 100 day SMA | 43.66 | 43.63 | 43.59 | | 150 day SMA | 40.98 | 40.91 | 40.83 | | 200 day SMA | 40.77 | 40.78 | 40.81 |
|
|
