MunjalAuto MUNJALAU full analysis,charts,indicators,moving averages,SMA,DMA,EMA,ADX,MACD,RSIMunjal Auto MUNJALAU WideScreen charts, DMA,SMA,EMA technical analysis, forecast prediction, by indicators ADX,MACD,RSI,CCI NSE stock exchange
operates under Auto Parts & Equipment sector
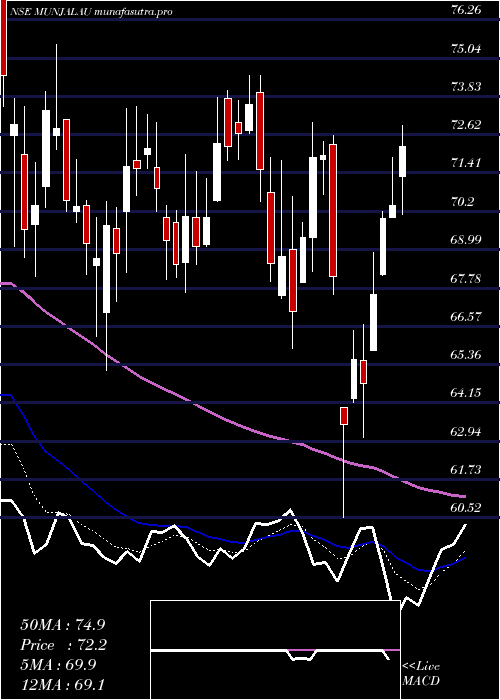
Daily price and charts and targets MunjalAuto Strong Daily Stock price targets for MunjalAuto MUNJALAU are 91.9 and 95.7 | Daily Target 1 | 88.96 | | Daily Target 2 | 91.03 | | Daily Target 3 | 92.763333333333 | | Daily Target 4 | 94.83 | | Daily Target 5 | 96.56 |
Daily price and volume Munjal Auto
| Date |
Closing |
Open |
Range |
Volume |
Tue 28 October 2025 |
93.09 (2.94%) |
90.80 |
90.70 - 94.50 |
1.7093 times |
Mon 27 October 2025 |
90.43 (-1.01%) |
90.91 |
90.00 - 91.89 |
0.6261 times |
Fri 24 October 2025 |
91.35 (-1.02%) |
92.40 |
90.70 - 92.40 |
0.6128 times |
Thu 23 October 2025 |
92.29 (-0.91%) |
93.21 |
91.15 - 93.79 |
0.6771 times |
Tue 21 October 2025 |
93.14 (0.69%) |
92.80 |
92.71 - 93.92 |
0.287 times |
Mon 20 October 2025 |
92.50 (0.86%) |
92.00 |
90.66 - 92.95 |
0.868 times |
Fri 17 October 2025 |
91.71 (-1.73%) |
93.29 |
91.07 - 93.62 |
0.8576 times |
Thu 16 October 2025 |
93.32 (-0.47%) |
94.00 |
92.68 - 94.62 |
0.7795 times |
Wed 15 October 2025 |
93.76 (1.81%) |
96.40 |
93.01 - 96.42 |
1.3575 times |
Tue 14 October 2025 |
92.09 (-3.96%) |
95.51 |
91.40 - 96.80 |
2.2251 times |
Mon 13 October 2025 |
95.89 (-2.64%) |
98.50 |
95.16 - 98.88 |
1.3721 times |
Weekly price and charts MunjalAuto Strong weekly Stock price targets for MunjalAuto MUNJALAU are 91.55 and 96.05 | Weekly Target 1 | 88.03 | | Weekly Target 2 | 90.56 | | Weekly Target 3 | 92.53 | | Weekly Target 4 | 95.06 | | Weekly Target 5 | 97.03 |
Weekly price and volumes for Munjal Auto
| Date |
Closing |
Open |
Range |
Volume |
Tue 28 October 2025 |
93.09 (1.9%) |
90.91 |
90.00 - 94.50 |
0.1226 times |
Fri 24 October 2025 |
91.35 (-0.39%) |
92.00 |
90.66 - 93.92 |
0.1283 times |
Fri 17 October 2025 |
91.71 (-6.88%) |
98.50 |
91.07 - 98.88 |
0.3459 times |
Fri 10 October 2025 |
98.49 (-6.49%) |
105.79 |
98.09 - 105.79 |
0.5856 times |
Fri 03 October 2025 |
105.33 (1.66%) |
104.40 |
101.46 - 114.55 |
1.9874 times |
Fri 26 September 2025 |
103.61 (14.78%) |
90.00 |
90.00 - 109.40 |
4.4608 times |
Fri 19 September 2025 |
90.27 (-1.34%) |
91.51 |
89.81 - 92.80 |
0.1626 times |
Fri 12 September 2025 |
91.50 (3.12%) |
89.20 |
89.12 - 99.20 |
0.8903 times |
Fri 05 September 2025 |
88.73 (2.51%) |
87.25 |
85.42 - 93.00 |
0.3489 times |
Fri 29 August 2025 |
86.56 (0.37%) |
87.15 |
86.11 - 97.20 |
0.9675 times |
Fri 22 August 2025 |
86.24 (14.19%) |
75.99 |
74.34 - 87.49 |
0.6584 times |
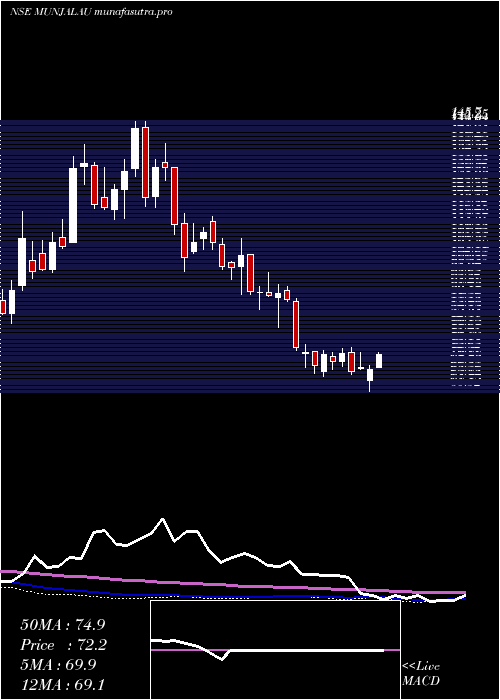
Monthly price and charts MunjalAuto Strong monthly Stock price targets for MunjalAuto MUNJALAU are 82.3 and 100.79 | Monthly Target 1 | 78.7 | | Monthly Target 2 | 85.9 | | Monthly Target 3 | 97.193333333333 | | Monthly Target 4 | 104.39 | | Monthly Target 5 | 115.68 |
Monthly price and volumes Munjal Auto
| Date |
Closing |
Open |
Range |
Volume |
Tue 28 October 2025 |
93.09 (-9.48%) |
103.24 |
90.00 - 108.49 |
1.0162 times |
Tue 30 September 2025 |
102.84 (18.81%) |
87.25 |
85.42 - 114.55 |
4.9255 times |
Fri 29 August 2025 |
86.56 (12.97%) |
76.62 |
70.72 - 97.20 |
1.1677 times |
Thu 31 July 2025 |
76.62 (1.74%) |
75.67 |
75.00 - 83.50 |
0.681 times |
Mon 30 June 2025 |
75.31 (-9.24%) |
83.30 |
71.96 - 83.40 |
0.4299 times |
Fri 30 May 2025 |
82.98 (14.84%) |
72.00 |
66.97 - 87.72 |
0.2898 times |
Wed 30 April 2025 |
72.26 (7.8%) |
67.95 |
60.52 - 78.00 |
0.2713 times |
Fri 28 March 2025 |
67.03 (-2.43%) |
67.00 |
65.18 - 74.50 |
0.3508 times |
Fri 28 February 2025 |
68.70 (-24.79%) |
92.40 |
66.26 - 93.75 |
0.303 times |
Fri 31 January 2025 |
91.35 (-6.27%) |
97.00 |
80.62 - 108.90 |
0.5649 times |
Tue 31 December 2024 |
97.46 (-9.49%) |
108.90 |
91.21 - 115.90 |
0.6797 times |
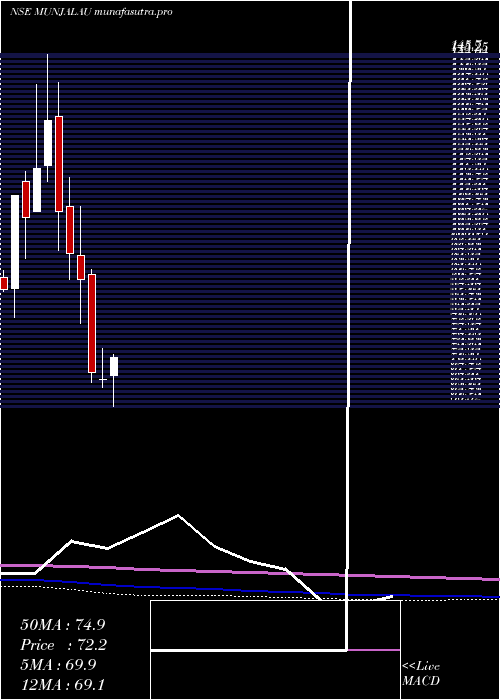
DMA SMA EMA moving averages of Munjal Auto MUNJALAU
DMA (daily moving average) of Munjal Auto MUNJALAU
| DMA period | DMA value | | 5 day DMA | 92.06 | | 12 day DMA | 93.17 | | 20 day DMA | 97.13 | | 35 day DMA | 95.98 | | 50 day DMA | 92.77 | | 100 day DMA | 84.74 | | 150 day DMA | 81.32 | | 200 day DMA | 81.36 | EMA (exponential moving average) of Munjal Auto MUNJALAU
| EMA period | EMA current | EMA prev | EMA prev2 | | 5 day EMA | 92.2 | 91.76 | 92.43 | | 12 day EMA | 93.61 | 93.7 | 94.3 | | 20 day EMA | 94.38 | 94.52 | 94.95 | | 35 day EMA | 93.04 | 93.04 | 93.19 | | 50 day EMA | 91.13 | 91.05 | 91.08 |
SMA (simple moving average) of Munjal Auto MUNJALAU
| SMA period | SMA current | SMA prev | SMA prev2 | | 5 day SMA | 92.06 | 91.94 | 92.2 | | 12 day SMA | 93.17 | 93.77 | 94.82 | | 20 day SMA | 97.13 | 97.66 | 98.42 | | 35 day SMA | 95.98 | 95.86 | 95.8 | | 50 day SMA | 92.77 | 92.42 | 92.1 | | 100 day SMA | 84.74 | 84.61 | 84.5 | | 150 day SMA | 81.32 | 81.18 | 81.04 | | 200 day SMA | 81.36 | 81.37 | 81.44 |
|
|
