MufinGreen MUFIN full analysis,charts,indicators,moving averages,SMA,DMA,EMA,ADX,MACD,RSIMufin Green MUFIN WideScreen charts, DMA,SMA,EMA technical analysis, forecast prediction, by indicators ADX,MACD,RSI,CCI NSE stock exchange
Daily price and charts and targets MufinGreen Strong Daily Stock price targets for MufinGreen MUFIN are 97.37 and 101.1 | Daily Target 1 | 94.48 | | Daily Target 2 | 96.53 | | Daily Target 3 | 98.21 | | Daily Target 4 | 100.26 | | Daily Target 5 | 101.94 |
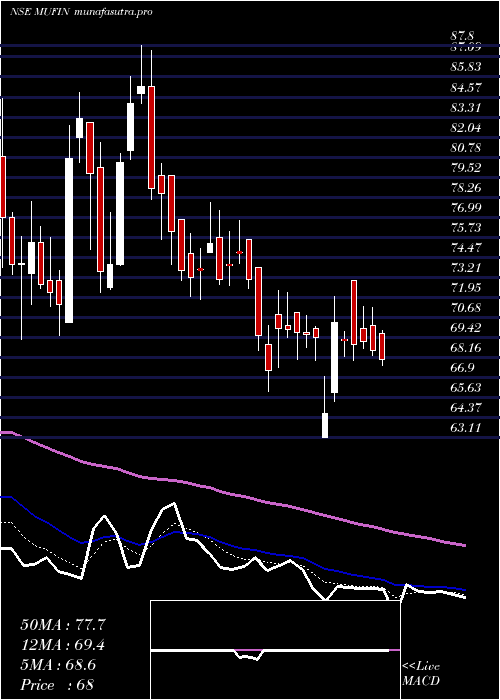
Daily price and volume Mufin Green
| Date |
Closing |
Open |
Range |
Volume |
Wed 29 October 2025 |
98.58 (2.62%) |
96.45 |
96.16 - 99.89 |
0.8356 times |
Tue 28 October 2025 |
96.06 (-0.92%) |
97.60 |
95.50 - 98.30 |
0.3703 times |
Mon 27 October 2025 |
96.95 (0.03%) |
97.90 |
95.05 - 98.44 |
0.6509 times |
Fri 24 October 2025 |
96.92 (2.07%) |
94.95 |
94.21 - 97.84 |
0.5584 times |
Thu 23 October 2025 |
94.95 (-5.38%) |
100.35 |
94.11 - 100.68 |
1.971 times |
Tue 21 October 2025 |
100.35 (-0.19%) |
102.00 |
99.46 - 103.03 |
0.6334 times |
Mon 20 October 2025 |
100.54 (3.65%) |
97.30 |
96.45 - 101.40 |
2.1525 times |
Fri 17 October 2025 |
97.00 (1.56%) |
95.50 |
95.03 - 99.90 |
0.8869 times |
Thu 16 October 2025 |
95.51 (-0.04%) |
96.80 |
94.35 - 97.90 |
0.5182 times |
Wed 15 October 2025 |
95.55 (3.93%) |
92.00 |
91.99 - 96.50 |
1.4227 times |
Tue 14 October 2025 |
91.94 (2.77%) |
90.33 |
89.43 - 92.99 |
0.8863 times |
Weekly price and charts MufinGreen Strong weekly Stock price targets for MufinGreen MUFIN are 96.82 and 101.66 | Weekly Target 1 | 93 | | Weekly Target 2 | 95.79 | | Weekly Target 3 | 97.84 | | Weekly Target 4 | 100.63 | | Weekly Target 5 | 102.68 |
Weekly price and volumes for Mufin Green
| Date |
Closing |
Open |
Range |
Volume |
Wed 29 October 2025 |
98.58 (1.71%) |
97.90 |
95.05 - 99.89 |
0.9602 times |
Fri 24 October 2025 |
96.92 (-0.08%) |
97.30 |
94.11 - 103.03 |
2.7484 times |
Fri 17 October 2025 |
97.00 (10.2%) |
88.89 |
88.12 - 99.90 |
2.0711 times |
Fri 10 October 2025 |
88.02 (-0.52%) |
88.30 |
85.13 - 89.86 |
0.6555 times |
Fri 03 October 2025 |
88.48 (2.51%) |
86.87 |
85.30 - 91.99 |
0.2427 times |
Fri 26 September 2025 |
86.31 (-3.65%) |
89.39 |
85.27 - 89.42 |
0.4008 times |
Fri 19 September 2025 |
89.58 (0.98%) |
88.71 |
87.24 - 92.60 |
0.487 times |
Fri 12 September 2025 |
88.71 (5.95%) |
85.50 |
85.50 - 92.77 |
1.9434 times |
Fri 05 September 2025 |
83.73 (-2.23%) |
85.99 |
82.99 - 87.77 |
0.2124 times |
Fri 29 August 2025 |
85.64 (-2.59%) |
89.45 |
83.22 - 89.45 |
0.2786 times |
Fri 22 August 2025 |
87.92 (-5.34%) |
91.50 |
85.57 - 93.70 |
0.3769 times |

Monthly price and charts MufinGreen Strong monthly Stock price targets for MufinGreen MUFIN are 91.86 and 109.76 | Monthly Target 1 | 77.68 | | Monthly Target 2 | 88.13 | | Monthly Target 3 | 95.58 | | Monthly Target 4 | 106.03 | | Monthly Target 5 | 113.48 |
Monthly price and volumes Mufin Green
| Date |
Closing |
Open |
Range |
Volume |
Wed 29 October 2025 |
98.58 (12.01%) |
88.13 |
85.13 - 103.03 |
1.9951 times |
Tue 30 September 2025 |
88.01 (2.77%) |
85.99 |
82.99 - 92.77 |
0.9679 times |
Fri 29 August 2025 |
85.64 (-1.55%) |
86.98 |
83.22 - 94.50 |
0.5626 times |
Thu 31 July 2025 |
86.99 (13.56%) |
76.89 |
75.99 - 94.38 |
1.6522 times |
Mon 30 June 2025 |
76.60 (-0.3%) |
76.79 |
69.50 - 82.00 |
0.7595 times |
Fri 30 May 2025 |
76.83 (3.34%) |
74.88 |
64.00 - 89.00 |
1.0893 times |
Wed 30 April 2025 |
74.35 (6.2%) |
70.20 |
63.11 - 84.36 |
1.0211 times |
Fri 28 March 2025 |
70.01 (-12.22%) |
80.16 |
66.00 - 87.80 |
0.7761 times |
Fri 28 February 2025 |
79.76 (-14.48%) |
93.00 |
69.30 - 93.99 |
0.6162 times |
Fri 31 January 2025 |
93.27 (-11.9%) |
105.77 |
86.00 - 110.17 |
0.56 times |
Tue 31 December 2024 |
105.87 (-14.3%) |
126.59 |
102.36 - 128.00 |
0.6291 times |

DMA SMA EMA moving averages of Mufin Green MUFIN
DMA (daily moving average) of Mufin Green MUFIN
| DMA period | DMA value | | 5 day DMA | 96.69 | | 12 day DMA | 96.15 | | 20 day DMA | 92.84 | | 35 day DMA | 90.97 | | 50 day DMA | 89.77 | | 100 day DMA | 86.8 | | 150 day DMA | 82.53 | | 200 day DMA | 83.44 | EMA (exponential moving average) of Mufin Green MUFIN
| EMA period | EMA current | EMA prev | EMA prev2 | | 5 day EMA | 97.25 | 96.59 | 96.86 | | 12 day EMA | 95.69 | 95.16 | 95 | | 20 day EMA | 94.03 | 93.55 | 93.29 | | 35 day EMA | 92.22 | 91.85 | 91.6 | | 50 day EMA | 90.53 | 90.2 | 89.96 |
SMA (simple moving average) of Mufin Green MUFIN
| SMA period | SMA current | SMA prev | SMA prev2 | | 5 day SMA | 96.69 | 97.05 | 97.94 | | 12 day SMA | 96.15 | 95.27 | 94.68 | | 20 day SMA | 92.84 | 92.19 | 91.71 | | 35 day SMA | 90.97 | 90.69 | 90.34 | | 50 day SMA | 89.77 | 89.65 | 89.59 | | 100 day SMA | 86.8 | 86.57 | 86.38 | | 150 day SMA | 82.53 | 82.36 | 82.22 | | 200 day SMA | 83.44 | 83.47 | 83.5 |
|
|
