Mstc MSTCLTD full analysis,charts,indicators,moving averages,SMA,DMA,EMA,ADX,MACD,RSIMstc MSTCLTD WideScreen charts, DMA,SMA,EMA technical analysis, forecast prediction, by indicators ADX,MACD,RSI,CCI NSE stock exchange
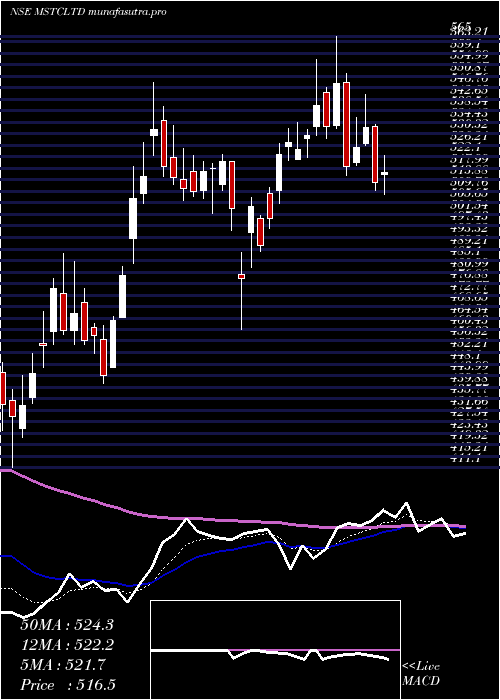
Daily price and charts and targets Mstc Strong Daily Stock price targets for Mstc MSTCLTD are 527.8 and 536.55 | Daily Target 1 | 526.05 | | Daily Target 2 | 529.55 | | Daily Target 3 | 534.8 | | Daily Target 4 | 538.3 | | Daily Target 5 | 543.55 |
Daily price and volume Mstc
| Date |
Closing |
Open |
Range |
Volume |
Tue 28 October 2025 |
533.05 (-0.05%) |
538.60 |
531.30 - 540.05 |
0.4175 times |
Mon 27 October 2025 |
533.30 (-0.02%) |
534.05 |
528.00 - 541.20 |
0.6385 times |
Fri 24 October 2025 |
533.40 (-0.79%) |
537.40 |
532.00 - 542.90 |
0.528 times |
Thu 23 October 2025 |
537.65 (-2.16%) |
550.00 |
533.40 - 550.00 |
0.8433 times |
Tue 21 October 2025 |
549.50 (0.47%) |
550.00 |
542.65 - 550.00 |
0.4361 times |
Mon 20 October 2025 |
546.95 (2%) |
541.90 |
538.00 - 549.00 |
0.7456 times |
Fri 17 October 2025 |
536.20 (-1.25%) |
546.50 |
531.90 - 546.50 |
0.635 times |
Thu 16 October 2025 |
543.00 (0.43%) |
543.90 |
540.05 - 551.40 |
1.4597 times |
Wed 15 October 2025 |
540.70 (5.79%) |
512.10 |
509.80 - 545.00 |
3.4829 times |
Tue 14 October 2025 |
511.10 (-3.52%) |
532.00 |
509.10 - 533.80 |
0.8134 times |
Mon 13 October 2025 |
529.75 (-2.5%) |
540.00 |
528.15 - 542.45 |
0.7893 times |
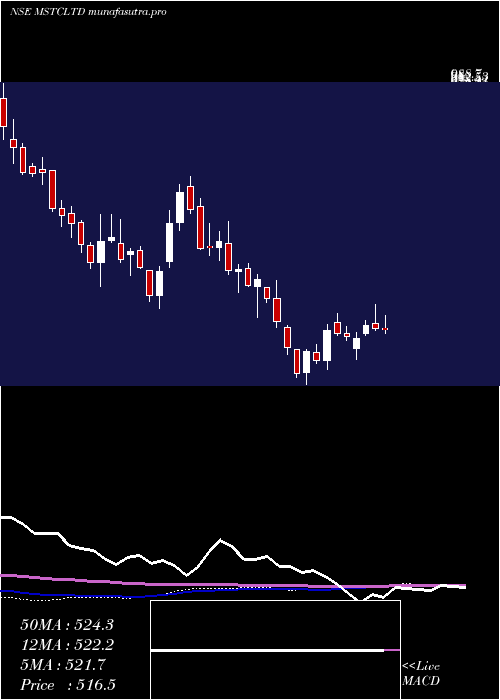
Weekly price and charts Mstc Strong weekly Stock price targets for Mstc MSTCLTD are 523.93 and 537.13 | Weekly Target 1 | 520.88 | | Weekly Target 2 | 526.97 | | Weekly Target 3 | 534.08333333333 | | Weekly Target 4 | 540.17 | | Weekly Target 5 | 547.28 |
Weekly price and volumes for Mstc
| Date |
Closing |
Open |
Range |
Volume |
Tue 28 October 2025 |
533.05 (-0.07%) |
534.05 |
528.00 - 541.20 |
0.1837 times |
Fri 24 October 2025 |
533.40 (-0.52%) |
541.90 |
532.00 - 550.00 |
0.444 times |
Fri 17 October 2025 |
536.20 (-1.32%) |
540.00 |
509.10 - 551.40 |
1.2488 times |
Fri 10 October 2025 |
543.35 (3.9%) |
524.65 |
517.50 - 558.30 |
2.2121 times |
Fri 03 October 2025 |
522.95 (8.15%) |
484.30 |
466.80 - 528.00 |
0.5596 times |
Fri 26 September 2025 |
483.55 (-7.21%) |
521.00 |
481.60 - 534.30 |
0.5976 times |
Fri 19 September 2025 |
521.15 (-1.19%) |
532.45 |
519.45 - 545.40 |
0.7328 times |
Fri 12 September 2025 |
527.45 (5.35%) |
501.95 |
500.00 - 546.40 |
1.4371 times |
Fri 05 September 2025 |
500.65 (10.95%) |
460.00 |
451.35 - 507.20 |
0.888 times |
Fri 29 August 2025 |
451.25 (0.22%) |
452.95 |
431.35 - 474.20 |
1.6964 times |
Fri 22 August 2025 |
450.25 (1.15%) |
447.95 |
447.55 - 484.30 |
0.8039 times |
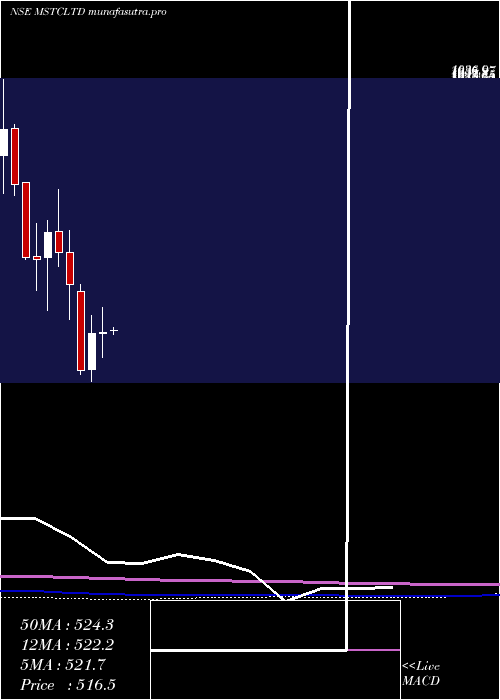
Monthly price and charts Mstc Strong monthly Stock price targets for Mstc MSTCLTD are 503.53 and 587.83 | Monthly Target 1 | 437.48 | | Monthly Target 2 | 485.27 | | Monthly Target 3 | 521.78333333333 | | Monthly Target 4 | 569.57 | | Monthly Target 5 | 606.08 |
Monthly price and volumes Mstc
| Date |
Closing |
Open |
Range |
Volume |
Tue 28 October 2025 |
533.05 (11.89%) |
476.40 |
474.00 - 558.30 |
1.27 times |
Tue 30 September 2025 |
476.40 (5.57%) |
460.00 |
451.35 - 546.40 |
1.0882 times |
Fri 29 August 2025 |
451.25 (-5.61%) |
478.80 |
431.35 - 490.20 |
0.9259 times |
Thu 31 July 2025 |
478.05 (-12.86%) |
548.60 |
474.95 - 562.50 |
0.5696 times |
Mon 30 June 2025 |
548.60 (-1.3%) |
554.85 |
490.05 - 574.95 |
1.0151 times |
Fri 30 May 2025 |
555.85 (8.35%) |
516.00 |
473.40 - 582.45 |
0.9594 times |
Wed 30 April 2025 |
513.00 (0.61%) |
510.00 |
460.55 - 565.00 |
0.7741 times |
Fri 28 March 2025 |
509.90 (17.57%) |
434.95 |
411.10 - 548.80 |
1.4911 times |
Fri 28 February 2025 |
433.70 (-29.23%) |
597.00 |
424.50 - 611.80 |
1.0833 times |
Fri 31 January 2025 |
612.85 (-9.74%) |
678.95 |
540.45 - 724.30 |
0.8232 times |
Tue 31 December 2024 |
679.00 (-5.64%) |
723.00 |
650.00 - 809.75 |
1.3802 times |
DMA SMA EMA moving averages of Mstc MSTCLTD
DMA (daily moving average) of Mstc MSTCLTD
| DMA period | DMA value | | 5 day DMA | 537.38 | | 12 day DMA | 536.5 | | 20 day DMA | 527.42 | | 35 day DMA | 524.96 | | 50 day DMA | 507.13 | | 100 day DMA | 512.18 | | 150 day DMA | 517.24 | | 200 day DMA | 524.32 | EMA (exponential moving average) of Mstc MSTCLTD
| EMA period | EMA current | EMA prev | EMA prev2 | | 5 day EMA | 535.5 | 536.73 | 538.44 | | 12 day EMA | 534.31 | 534.54 | 534.77 | | 20 day EMA | 529.65 | 529.29 | 528.87 | | 35 day EMA | 518.25 | 517.38 | 516.44 | | 50 day EMA | 507.05 | 505.99 | 504.88 |
SMA (simple moving average) of Mstc MSTCLTD
| SMA period | SMA current | SMA prev | SMA prev2 | | 5 day SMA | 537.38 | 540.16 | 540.74 | | 12 day SMA | 536.5 | 537.44 | 537.24 | | 20 day SMA | 527.42 | 524.95 | 523.34 | | 35 day SMA | 524.96 | 524.03 | 522.91 | | 50 day SMA | 507.13 | 505.74 | 504.47 | | 100 day SMA | 512.18 | 512.45 | 512.63 | | 150 day SMA | 517.24 | 516.88 | 516.42 | | 200 day SMA | 524.32 | 524.9 | 525.67 |
|
|
