MeghmaniOrganics MOL full analysis,charts,indicators,moving averages,SMA,DMA,EMA,ADX,MACD,RSIMeghmani Organics MOL WideScreen charts, DMA,SMA,EMA technical analysis, forecast prediction, by indicators ADX,MACD,RSI,CCI NSE stock exchange
Daily price and charts and targets MeghmaniOrganics Strong Daily Stock price targets for MeghmaniOrganics MOL are 80.38 and 82.07 | Daily Target 1 | 79.15 | | Daily Target 2 | 79.92 | | Daily Target 3 | 80.836666666667 | | Daily Target 4 | 81.61 | | Daily Target 5 | 82.53 |
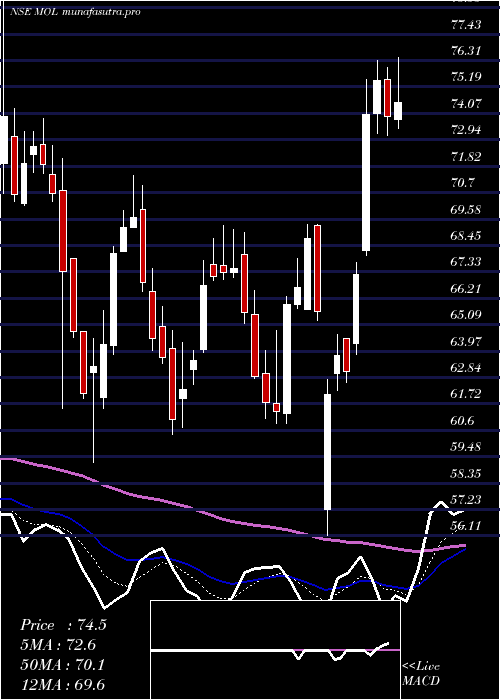
Daily price and volume Meghmani Organics
| Date |
Closing |
Open |
Range |
Volume |
Tue 28 October 2025 |
80.70 (0.65%) |
80.18 |
80.06 - 81.75 |
1.1593 times |
Mon 27 October 2025 |
80.18 (-0.88%) |
80.74 |
80.10 - 81.79 |
0.9011 times |
Fri 24 October 2025 |
80.89 (-1.43%) |
82.29 |
80.40 - 82.68 |
0.8197 times |
Thu 23 October 2025 |
82.06 (0.37%) |
83.30 |
81.60 - 83.45 |
1.3154 times |
Tue 21 October 2025 |
81.76 (1.82%) |
80.30 |
80.30 - 81.95 |
0.5811 times |
Mon 20 October 2025 |
80.30 (1.36%) |
79.98 |
79.30 - 81.21 |
0.6096 times |
Fri 17 October 2025 |
79.22 (-1.59%) |
80.08 |
78.93 - 80.59 |
0.8414 times |
Thu 16 October 2025 |
80.50 (0.5%) |
80.10 |
80.06 - 81.40 |
0.7924 times |
Wed 15 October 2025 |
80.10 (0.6%) |
79.65 |
78.51 - 80.70 |
1.8101 times |
Tue 14 October 2025 |
79.62 (-1.07%) |
80.49 |
79.28 - 81.48 |
1.1697 times |
Mon 13 October 2025 |
80.48 (-0.65%) |
81.41 |
80.10 - 81.60 |
0.9175 times |
Weekly price and charts MeghmaniOrganics Strong weekly Stock price targets for MeghmaniOrganics MOL are 79.52 and 81.25 | Weekly Target 1 | 79.12 | | Weekly Target 2 | 79.91 | | Weekly Target 3 | 80.85 | | Weekly Target 4 | 81.64 | | Weekly Target 5 | 82.58 |
Weekly price and volumes for Meghmani Organics
| Date |
Closing |
Open |
Range |
Volume |
Tue 28 October 2025 |
80.70 (-0.23%) |
80.74 |
80.06 - 81.79 |
0.3121 times |
Fri 24 October 2025 |
80.89 (2.11%) |
79.98 |
79.30 - 83.45 |
0.5038 times |
Fri 17 October 2025 |
79.22 (-2.21%) |
81.41 |
78.51 - 81.60 |
0.8378 times |
Fri 10 October 2025 |
81.01 (-4.14%) |
84.52 |
80.64 - 85.35 |
0.8242 times |
Fri 03 October 2025 |
84.51 (4.5%) |
81.30 |
80.18 - 84.88 |
0.6577 times |
Fri 26 September 2025 |
80.87 (-5.95%) |
85.99 |
80.44 - 87.20 |
1.0343 times |
Fri 19 September 2025 |
85.99 (7.03%) |
80.70 |
80.40 - 87.75 |
2.1282 times |
Fri 12 September 2025 |
80.34 (0.27%) |
85.03 |
80.00 - 85.75 |
1.3888 times |
Fri 05 September 2025 |
80.12 (-2.1%) |
82.18 |
79.01 - 84.47 |
1.5222 times |
Fri 29 August 2025 |
81.84 (-5.42%) |
87.00 |
81.67 - 87.49 |
0.7909 times |
Fri 22 August 2025 |
86.53 (3.65%) |
84.09 |
83.42 - 88.88 |
1.6158 times |

Monthly price and charts MeghmaniOrganics Strong monthly Stock price targets for MeghmaniOrganics MOL are 79.61 and 86.45 | Monthly Target 1 | 74.68 | | Monthly Target 2 | 77.69 | | Monthly Target 3 | 81.52 | | Monthly Target 4 | 84.53 | | Monthly Target 5 | 88.36 |
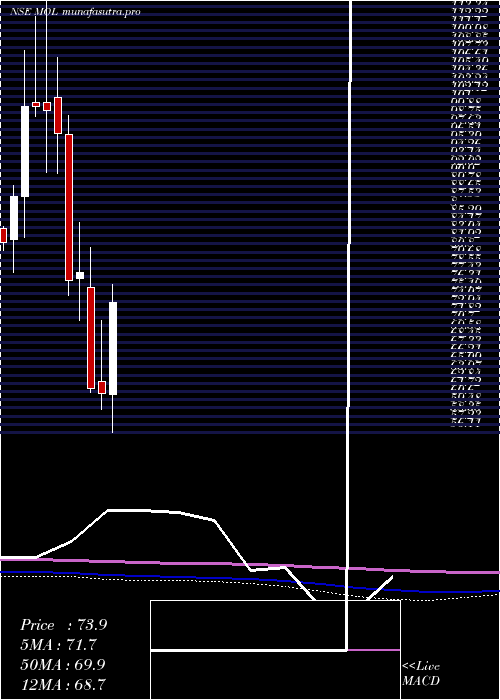
Monthly price and volumes Meghmani Organics
| Date |
Closing |
Open |
Range |
Volume |
Tue 28 October 2025 |
80.70 (0.06%) |
80.65 |
78.51 - 85.35 |
0.2983 times |
Tue 30 September 2025 |
80.65 (-1.45%) |
82.18 |
79.01 - 87.75 |
0.6689 times |
Fri 29 August 2025 |
81.84 (-17.47%) |
98.99 |
81.67 - 101.85 |
0.7041 times |
Thu 31 July 2025 |
99.16 (0.19%) |
99.35 |
93.27 - 106.30 |
1.8779 times |
Mon 30 June 2025 |
98.97 (22.49%) |
80.80 |
79.36 - 101.34 |
1.5996 times |
Fri 30 May 2025 |
80.80 (17.96%) |
68.29 |
66.10 - 82.50 |
1.2118 times |
Wed 30 April 2025 |
68.50 (11.58%) |
61.30 |
56.11 - 77.09 |
0.8502 times |
Fri 28 March 2025 |
61.39 (-1.27%) |
63.05 |
59.24 - 71.43 |
1.0162 times |
Fri 28 February 2025 |
62.18 (-20.29%) |
76.00 |
61.51 - 81.40 |
0.9321 times |
Fri 31 January 2025 |
78.01 (1.36%) |
77.19 |
71.50 - 84.85 |
0.8409 times |
Tue 31 December 2024 |
76.96 (-20.7%) |
96.90 |
74.86 - 99.44 |
0.8102 times |
DMA SMA EMA moving averages of Meghmani Organics MOL
DMA (daily moving average) of Meghmani Organics MOL
| DMA period | DMA value | | 5 day DMA | 81.12 | | 12 day DMA | 80.57 | | 20 day DMA | 81.34 | | 35 day DMA | 82.21 | | 50 day DMA | 82.63 | | 100 day DMA | 88.8 | | 150 day DMA | 83.58 | | 200 day DMA | 80.97 | EMA (exponential moving average) of Meghmani Organics MOL
| EMA period | EMA current | EMA prev | EMA prev2 | | 5 day EMA | 80.75 | 80.77 | 81.07 | | 12 day EMA | 80.97 | 81.02 | 81.17 | | 20 day EMA | 81.39 | 81.46 | 81.6 | | 35 day EMA | 81.97 | 82.05 | 82.16 | | 50 day EMA | 82.73 | 82.81 | 82.92 |
SMA (simple moving average) of Meghmani Organics MOL
| SMA period | SMA current | SMA prev | SMA prev2 | | 5 day SMA | 81.12 | 81.04 | 80.85 | | 12 day SMA | 80.57 | 80.62 | 80.8 | | 20 day SMA | 81.34 | 81.35 | 81.51 | | 35 day SMA | 82.21 | 82.19 | 82.18 | | 50 day SMA | 82.63 | 82.68 | 82.79 | | 100 day SMA | 88.8 | 88.9 | 88.98 | | 150 day SMA | 83.58 | 83.48 | 83.37 | | 200 day SMA | 80.97 | 80.95 | 80.96 |
|
|
