MohitIndustries MOHITIND_BE full analysis,charts,indicators,moving averages,SMA,DMA,EMA,ADX,MACD,RSIMohit Industries MOHITIND_BE WideScreen charts, DMA,SMA,EMA technical analysis, forecast prediction, by indicators ADX,MACD,RSI,CCI NSE stock exchange
Daily price and charts and targets MohitIndustries Strong Daily Stock price targets for MohitIndustries MOHITIND_BE are 31.77 and 33.41 | Daily Target 1 | 31.4 | | Daily Target 2 | 32.14 | | Daily Target 3 | 33.043333333333 | | Daily Target 4 | 33.78 | | Daily Target 5 | 34.68 |
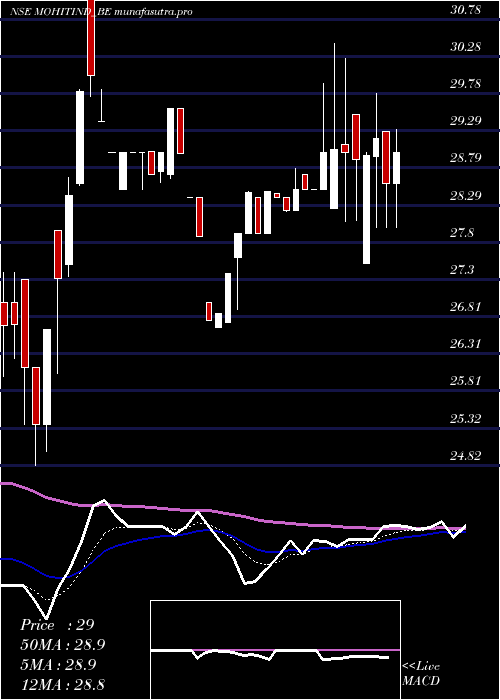
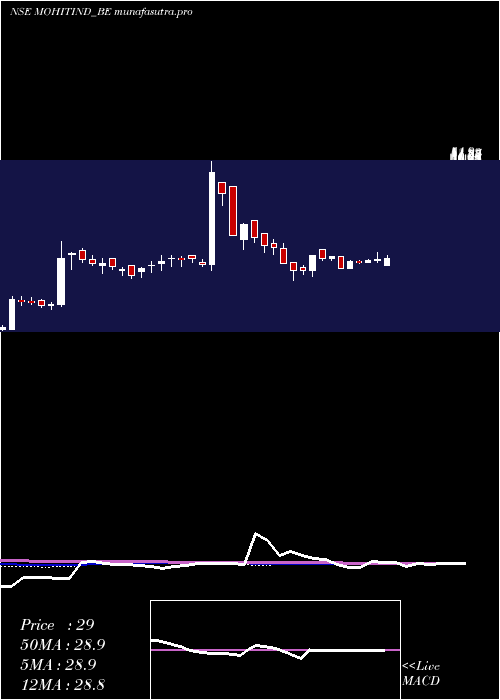
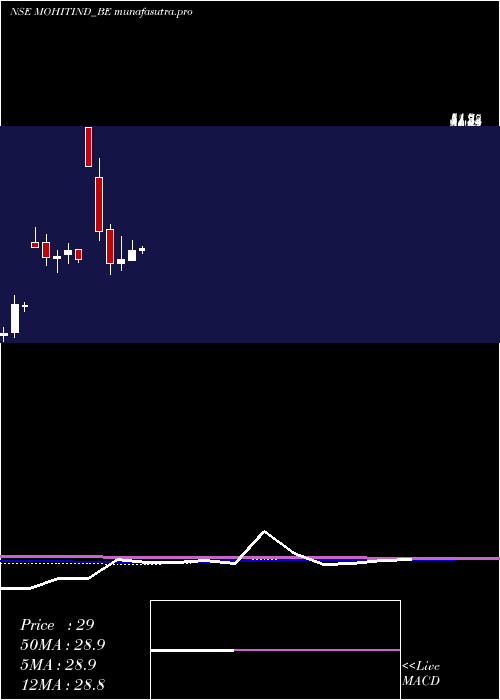
Daily price and volume Mohit Industries
| Date |
Closing |
Open |
Range |
Volume |
Tue 28 October 2025 |
32.87 (-2.84%) |
33.10 |
32.31 - 33.95 |
2.4003 times |
Mon 27 October 2025 |
33.83 (2.39%) |
33.00 |
32.25 - 34.00 |
0.9443 times |
Fri 24 October 2025 |
33.04 (-0.03%) |
33.90 |
32.50 - 33.90 |
1.0019 times |
Thu 23 October 2025 |
33.05 (0.95%) |
32.15 |
32.15 - 33.70 |
0.6447 times |
Tue 21 October 2025 |
32.74 (1.33%) |
33.00 |
32.31 - 33.00 |
0.1413 times |
Mon 20 October 2025 |
32.31 (-1.61%) |
32.25 |
31.50 - 32.83 |
0.6538 times |
Fri 17 October 2025 |
32.84 (2.31%) |
32.10 |
31.50 - 33.29 |
1.0799 times |
Thu 16 October 2025 |
32.10 (-1.8%) |
33.24 |
31.50 - 33.25 |
1.6072 times |
Wed 15 October 2025 |
32.69 (1.18%) |
32.50 |
32.25 - 33.35 |
0.8174 times |
Tue 14 October 2025 |
32.31 (-3%) |
32.64 |
32.10 - 33.51 |
0.7092 times |
Mon 13 October 2025 |
33.31 (1.46%) |
32.85 |
31.66 - 33.85 |
1.0571 times |
Weekly price and charts MohitIndustries Strong weekly Stock price targets for MohitIndustries MOHITIND_BE are 31.69 and 33.44 | Weekly Target 1 | 31.29 | | Weekly Target 2 | 32.08 | | Weekly Target 3 | 33.04 | | Weekly Target 4 | 33.83 | | Weekly Target 5 | 34.79 |
Weekly price and volumes for Mohit Industries
| Date |
Closing |
Open |
Range |
Volume |
Tue 28 October 2025 |
32.87 (-0.51%) |
33.00 |
32.25 - 34.00 |
0.6224 times |
Fri 24 October 2025 |
33.04 (0.61%) |
32.25 |
31.50 - 33.90 |
0.4544 times |
Fri 17 October 2025 |
32.84 (0.03%) |
32.85 |
31.50 - 33.85 |
0.9808 times |
Fri 10 October 2025 |
32.83 (-0.85%) |
33.50 |
31.45 - 34.45 |
1.2941 times |
Fri 03 October 2025 |
33.11 (0.39%) |
32.25 |
31.55 - 34.50 |
0.5387 times |
Fri 26 September 2025 |
32.98 (0.52%) |
31.16 |
31.16 - 34.75 |
2.1035 times |
Fri 19 September 2025 |
32.81 (13.18%) |
35.00 |
32.80 - 37.65 |
1.9558 times |
Fri 02 May 2025 |
28.99 (0.31%) |
27.51 |
27.51 - 29.79 |
0.617 times |
Fri 25 April 2025 |
28.90 (1.4%) |
28.50 |
28.08 - 30.45 |
1.3877 times |
Thu 17 April 2025 |
28.50 (0.99%) |
28.22 |
28.22 - 28.78 |
0.0457 times |
Fri 11 April 2025 |
28.22 (-0.84%) |
28.40 |
27.92 - 28.47 |
0.2658 times |
Monthly price and charts MohitIndustries Strong monthly Stock price targets for MohitIndustries MOHITIND_BE are 30.66 and 33.66 | Monthly Target 1 | 29.92 | | Monthly Target 2 | 31.4 | | Monthly Target 3 | 32.923333333333 | | Monthly Target 4 | 34.4 | | Monthly Target 5 | 35.92 |
Monthly price and volumes Mohit Industries
| Date |
Closing |
Open |
Range |
Volume |
Tue 28 October 2025 |
32.87 (-0.21%) |
33.50 |
31.45 - 34.45 |
0.5831 times |
Tue 30 September 2025 |
32.94 (13.63%) |
35.00 |
31.16 - 37.65 |
0.7048 times |
Fri 02 May 2025 |
28.99 (1.43%) |
28.58 |
28.00 - 29.30 |
0.0288 times |
Wed 30 April 2025 |
28.58 (6.8%) |
26.66 |
26.66 - 30.45 |
0.4466 times |
Fri 28 March 2025 |
26.76 (2.41%) |
26.13 |
24.82 - 31.29 |
0.7122 times |
Fri 28 February 2025 |
26.13 (-18.8%) |
32.49 |
23.90 - 33.49 |
1.2233 times |
Fri 31 January 2025 |
32.18 (-27.86%) |
42.37 |
30.50 - 46.00 |
3.4062 times |
Tue 31 December 2024 |
44.61 (66.33%) |
51.90 |
44.61 - 51.90 |
0.3276 times |
Mon 07 October 2024 |
26.82 (-5.96%) |
28.71 |
26.27 - 28.72 |
0.2043 times |
Mon 30 September 2024 |
28.52 (4.05%) |
27.79 |
26.11 - 29.85 |
2.363 times |
Fri 30 August 2024 |
27.41 (0.77%) |
27.00 |
24.35 - 28.45 |
1.3527 times |
DMA SMA EMA moving averages of Mohit Industries MOHITIND_BE
DMA (daily moving average) of Mohit Industries MOHITIND_BE
| DMA period | DMA value | | 5 day DMA | 33.11 | | 12 day DMA | 32.83 | | 20 day DMA | 32.92 | | 35 day DMA | 32.1 | | 50 day DMA | 30.9 | | 100 day DMA | 30.67 | | 150 day DMA | 30.59 | | 200 day DMA | 28.97 | EMA (exponential moving average) of Mohit Industries MOHITIND_BE
| EMA period | EMA current | EMA prev | EMA prev2 | | 5 day EMA | 33.08 | 33.18 | 32.85 | | 12 day EMA | 32.91 | 32.92 | 32.75 | | 20 day EMA | 32.66 | 32.64 | 32.52 | | 35 day EMA | 31.81 | 31.75 | 31.63 | | 50 day EMA | 30.97 | 30.89 | 30.77 |
SMA (simple moving average) of Mohit Industries MOHITIND_BE
| SMA period | SMA current | SMA prev | SMA prev2 | | 5 day SMA | 33.11 | 32.99 | 32.8 | | 12 day SMA | 32.83 | 32.83 | 32.79 | | 20 day SMA | 32.92 | 32.93 | 32.88 | | 35 day SMA | 32.1 | 31.98 | 31.83 | | 50 day SMA | 30.9 | 30.83 | 30.73 | | 100 day SMA | 30.67 | 30.72 | 30.78 | | 150 day SMA | 30.59 | 30.54 | 30.49 | | 200 day SMA | 28.97 | 28.87 | 28.76 |
|
|
