MohitIndustries MOHITIND full analysis,charts,indicators,moving averages,SMA,DMA,EMA,ADX,MACD,RSIMohit Industries MOHITIND WideScreen charts, DMA,SMA,EMA technical analysis, forecast prediction, by indicators ADX,MACD,RSI,CCI NSE stock exchange
operates under Textiles sector
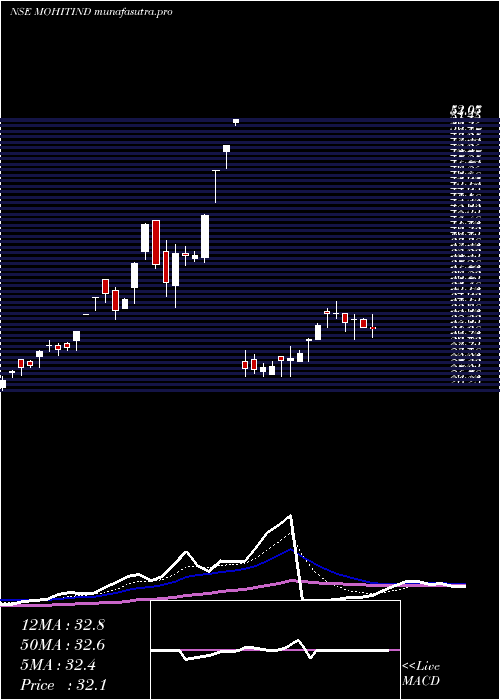
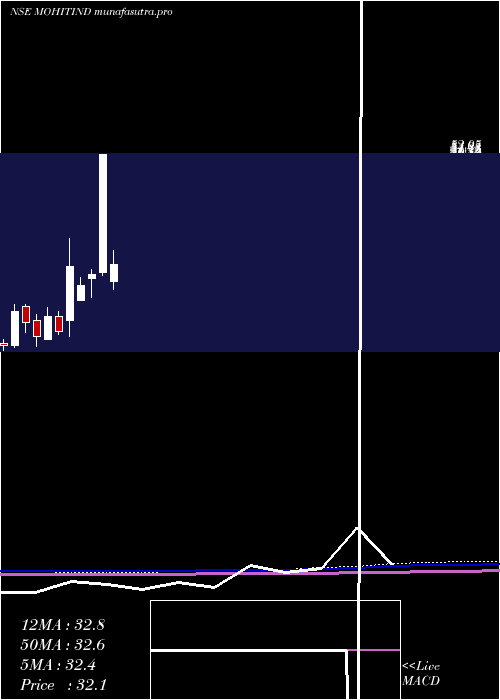
Daily price and charts and targets MohitIndustries Strong Daily Stock price targets for MohitIndustries MOHITIND are 30.85 and 33.33 | Daily Target 1 | 29.08 | | Daily Target 2 | 30.13 | | Daily Target 3 | 31.56 | | Daily Target 4 | 32.61 | | Daily Target 5 | 34.04 |
Daily price and volume Mohit Industries
| Date |
Closing |
Open |
Range |
Volume |
Wed 16 July 2025 |
31.18 (-0.92%) |
30.51 |
30.51 - 32.99 |
0.3042 times |
Tue 15 July 2025 |
31.47 (-0.29%) |
32.94 |
31.02 - 32.94 |
0.1359 times |
Mon 14 July 2025 |
31.56 (-2.44%) |
31.02 |
30.21 - 32.96 |
0.5064 times |
Fri 11 July 2025 |
32.35 (0.37%) |
32.94 |
31.16 - 32.95 |
0.9408 times |
Thu 10 July 2025 |
32.23 (0.69%) |
31.94 |
30.52 - 32.60 |
0.3465 times |
Wed 09 July 2025 |
32.01 (0.63%) |
31.26 |
31.26 - 32.68 |
0.4253 times |
Tue 08 July 2025 |
31.81 (0.38%) |
32.02 |
30.26 - 32.68 |
3.8048 times |
Mon 07 July 2025 |
31.69 (10%) |
28.81 |
28.81 - 31.69 |
3.0796 times |
Fri 04 July 2025 |
28.81 (1.44%) |
28.15 |
27.02 - 29.00 |
0.3078 times |
Thu 03 July 2025 |
28.40 (-0.28%) |
29.21 |
28.25 - 29.90 |
0.1488 times |
Wed 02 July 2025 |
28.48 (-3.06%) |
29.31 |
27.35 - 29.59 |
0.3534 times |
Weekly price and charts MohitIndustries Strong weekly Stock price targets for MohitIndustries MOHITIND are 30.7 and 33.48 | Weekly Target 1 | 28.68 | | Weekly Target 2 | 29.93 | | Weekly Target 3 | 31.46 | | Weekly Target 4 | 32.71 | | Weekly Target 5 | 34.24 |
Weekly price and volumes for Mohit Industries
| Date |
Closing |
Open |
Range |
Volume |
Wed 16 July 2025 |
31.18 (-3.62%) |
31.02 |
30.21 - 32.99 |
0.4162 times |
Fri 11 July 2025 |
32.35 (12.29%) |
28.81 |
28.81 - 32.95 |
3.7809 times |
Fri 04 July 2025 |
28.81 (-0.31%) |
29.79 |
27.02 - 29.90 |
0.4526 times |
Fri 27 June 2025 |
28.90 (-0.69%) |
29.09 |
28.21 - 30.49 |
0.3878 times |
Fri 20 June 2025 |
29.10 (-7.18%) |
31.15 |
28.70 - 32.70 |
0.5022 times |
Fri 13 June 2025 |
31.35 (3.6%) |
29.50 |
29.17 - 32.99 |
0.8054 times |
Fri 06 June 2025 |
30.26 (-6.86%) |
32.10 |
29.51 - 33.48 |
0.7448 times |
Fri 30 May 2025 |
32.49 (1.09%) |
30.61 |
30.61 - 34.59 |
0.8391 times |
Fri 23 May 2025 |
32.14 (-4.15%) |
33.53 |
31.05 - 34.69 |
0.6674 times |
Fri 16 May 2025 |
33.53 (15.42%) |
29.09 |
27.59 - 34.05 |
1.4036 times |
Fri 09 May 2025 |
29.05 (-44.19%) |
28.99 |
27.55 - 30.00 |
0.3963 times |
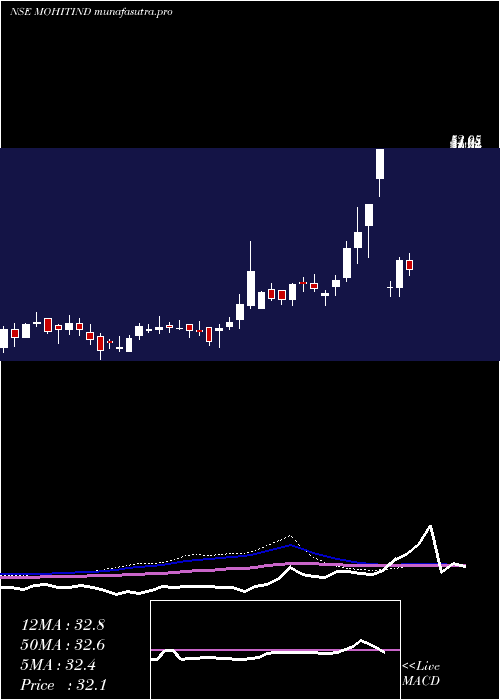
Monthly price and charts MohitIndustries Strong monthly Stock price targets for MohitIndustries MOHITIND are 29.1 and 35.07 | Monthly Target 1 | 24.43 | | Monthly Target 2 | 27.8 | | Monthly Target 3 | 30.396666666667 | | Monthly Target 4 | 33.77 | | Monthly Target 5 | 36.37 |
Monthly price and volumes Mohit Industries
| Date |
Closing |
Open |
Range |
Volume |
Wed 16 July 2025 |
31.18 (5.66%) |
28.55 |
27.02 - 32.99 |
0.3634 times |
Mon 30 June 2025 |
29.51 (-9.17%) |
32.10 |
28.21 - 33.48 |
0.1966 times |
Fri 30 May 2025 |
32.49 (-37.58%) |
28.99 |
27.55 - 34.69 |
0.2612 times |
Thu 26 December 2024 |
52.05 (72.47%) |
30.69 |
30.00 - 52.05 |
2.3818 times |
Fri 29 November 2024 |
30.18 (6.76%) |
29.58 |
26.11 - 31.19 |
0.8091 times |
Thu 31 October 2024 |
28.27 (-10.79%) |
25.51 |
25.51 - 29.67 |
0.4617 times |
Wed 26 June 2024 |
31.69 (58.85%) |
21.85 |
19.00 - 36.75 |
4.295 times |
Fri 31 May 2024 |
19.95 (-11.53%) |
22.55 |
19.30 - 23.60 |
0.3054 times |
Tue 30 April 2024 |
22.55 (19%) |
18.35 |
18.35 - 24.20 |
0.5898 times |
Thu 28 March 2024 |
18.95 (-11.66%) |
21.95 |
17.10 - 23.00 |
0.3359 times |
Thu 29 February 2024 |
21.45 (-8.53%) |
24.40 |
19.75 - 24.80 |
0.8911 times |
DMA SMA EMA moving averages of Mohit Industries MOHITIND
DMA (daily moving average) of Mohit Industries MOHITIND
| DMA period | DMA value | | 5 day DMA | 31.76 | | 12 day DMA | 30.78 | | 20 day DMA | 30.13 | | 35 day DMA | 30.5 | | 50 day DMA | 30.87 | | 100 day DMA | 31.55 | | 150 day DMA | 28.92 | | 200 day DMA | 26.96 | EMA (exponential moving average) of Mohit Industries MOHITIND
| EMA period | EMA current | EMA prev | EMA prev2 | | 5 day EMA | 31.46 | 31.6 | 31.66 | | 12 day EMA | 31.04 | 31.02 | 30.94 | | 20 day EMA | 30.83 | 30.79 | 30.72 | | 35 day EMA | 31.03 | 31.02 | 30.99 | | 50 day EMA | 31.48 | 31.49 | 31.49 |
SMA (simple moving average) of Mohit Industries MOHITIND
| SMA period | SMA current | SMA prev | SMA prev2 | | 5 day SMA | 31.76 | 31.92 | 31.99 | | 12 day SMA | 30.78 | 30.64 | 30.43 | | 20 day SMA | 30.13 | 30.07 | 30.08 | | 35 day SMA | 30.5 | 30.54 | 30.59 | | 50 day SMA | 30.87 | 30.82 | 30.75 | | 100 day SMA | 31.55 | 31.52 | 31.49 | | 150 day SMA | 28.92 | 28.86 | 28.8 | | 200 day SMA | 26.96 | 26.91 | 26.87 |
|
|
