MmpIndustries MMP full analysis,charts,indicators,moving averages,SMA,DMA,EMA,ADX,MACD,RSIMmp Industries MMP WideScreen charts, DMA,SMA,EMA technical analysis, forecast prediction, by indicators ADX,MACD,RSI,CCI NSE stock exchange
operates under REAL_ESTATE_INVESTMENT_TRUST sector
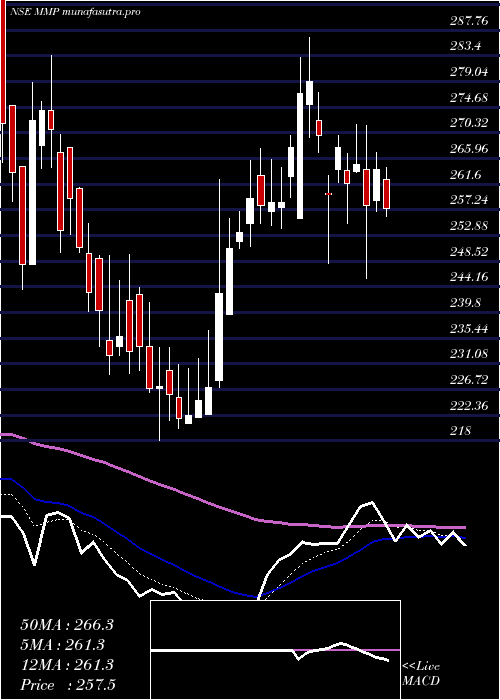
Daily price and charts and targets MmpIndustries Strong Daily Stock price targets for MmpIndustries MMP are 274.55 and 284.55 | Daily Target 1 | 272.03 | | Daily Target 2 | 277.07 | | Daily Target 3 | 282.03333333333 | | Daily Target 4 | 287.07 | | Daily Target 5 | 292.03 |
Daily price and volume Mmp Industries
| Date |
Closing |
Open |
Range |
Volume |
Wed 29 October 2025 |
282.10 (2.43%) |
287.00 |
277.00 - 287.00 |
1.2356 times |
Tue 28 October 2025 |
275.40 (6.27%) |
265.95 |
261.65 - 289.90 |
4.4059 times |
Mon 27 October 2025 |
259.15 (-1.43%) |
268.00 |
258.00 - 272.00 |
1.0022 times |
Fri 24 October 2025 |
262.90 (-1.65%) |
268.45 |
261.05 - 269.50 |
0.4641 times |
Thu 23 October 2025 |
267.30 (-1.18%) |
270.45 |
265.60 - 274.60 |
0.4021 times |
Tue 21 October 2025 |
270.50 (2.89%) |
263.65 |
260.30 - 275.85 |
0.3699 times |
Mon 20 October 2025 |
262.90 (0.08%) |
260.05 |
260.05 - 269.65 |
0.2969 times |
Fri 17 October 2025 |
262.70 (0.83%) |
260.00 |
257.35 - 265.95 |
0.8583 times |
Thu 16 October 2025 |
260.55 (-1.33%) |
262.05 |
260.00 - 269.50 |
0.6132 times |
Wed 15 October 2025 |
264.05 (0.53%) |
264.40 |
263.35 - 268.45 |
0.3519 times |
Tue 14 October 2025 |
262.65 (-2.83%) |
273.95 |
261.10 - 277.00 |
0.5429 times |
Weekly price and charts MmpIndustries Strong weekly Stock price targets for MmpIndustries MMP are 270.05 and 301.95 | Weekly Target 1 | 244.77 | | Weekly Target 2 | 263.43 | | Weekly Target 3 | 276.66666666667 | | Weekly Target 4 | 295.33 | | Weekly Target 5 | 308.57 |
Weekly price and volumes for Mmp Industries
| Date |
Closing |
Open |
Range |
Volume |
Wed 29 October 2025 |
282.10 (7.3%) |
268.00 |
258.00 - 289.90 |
1.7586 times |
Fri 24 October 2025 |
262.90 (0.08%) |
260.05 |
260.05 - 275.85 |
0.4057 times |
Fri 17 October 2025 |
262.70 (-5.52%) |
275.00 |
257.35 - 279.90 |
0.823 times |
Fri 10 October 2025 |
278.05 (-1.63%) |
281.00 |
266.55 - 290.80 |
1.0474 times |
Fri 03 October 2025 |
282.65 (1.15%) |
275.30 |
270.55 - 288.50 |
1.0304 times |
Fri 26 September 2025 |
279.45 (1.34%) |
271.55 |
271.55 - 289.30 |
0.9458 times |
Fri 19 September 2025 |
275.75 (-0.25%) |
276.70 |
274.00 - 298.05 |
1.5992 times |
Fri 12 September 2025 |
276.45 (0.34%) |
283.45 |
272.25 - 283.45 |
0.4905 times |
Fri 05 September 2025 |
275.50 (0.97%) |
273.40 |
269.00 - 285.45 |
0.9344 times |
Fri 29 August 2025 |
272.85 (-2.87%) |
283.30 |
265.00 - 290.05 |
0.9649 times |
Fri 22 August 2025 |
280.90 (11.23%) |
253.80 |
250.80 - 287.00 |
3.0338 times |

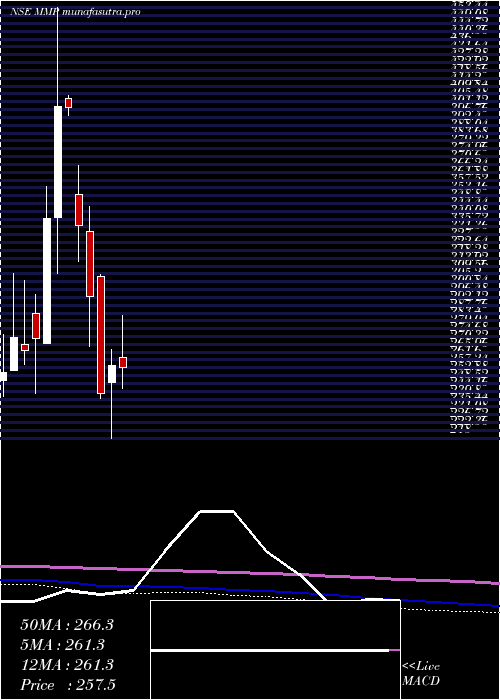
Monthly price and charts MmpIndustries Strong monthly Stock price targets for MmpIndustries MMP are 253 and 286.45 | Monthly Target 1 | 243.3 | | Monthly Target 2 | 262.7 | | Monthly Target 3 | 276.75 | | Monthly Target 4 | 296.15 | | Monthly Target 5 | 310.2 |
Monthly price and volumes Mmp Industries
| Date |
Closing |
Open |
Range |
Volume |
Wed 29 October 2025 |
282.10 (0.89%) |
283.55 |
257.35 - 290.80 |
0.5556 times |
Tue 30 September 2025 |
279.60 (2.47%) |
273.40 |
269.00 - 298.05 |
0.5151 times |
Fri 29 August 2025 |
272.85 (-0.82%) |
275.10 |
235.55 - 290.05 |
0.9293 times |
Thu 31 July 2025 |
275.10 (-1.92%) |
282.60 |
261.25 - 318.00 |
1.3743 times |
Mon 30 June 2025 |
280.49 (16.77%) |
240.21 |
239.98 - 298.72 |
1.7304 times |
Fri 30 May 2025 |
240.21 (-1.13%) |
240.00 |
231.50 - 287.00 |
1.0838 times |
Wed 30 April 2025 |
242.95 (-6.03%) |
262.90 |
228.20 - 286.45 |
0.9349 times |
Fri 28 March 2025 |
258.55 (6.33%) |
248.90 |
218.00 - 267.63 |
1.6031 times |
Fri 28 February 2025 |
243.15 (-18.12%) |
307.90 |
240.00 - 309.00 |
0.666 times |
Fri 31 January 2025 |
296.95 (-11.83%) |
333.10 |
269.10 - 346.90 |
0.6074 times |
Tue 31 December 2024 |
336.80 (-16.27%) |
353.90 |
316.55 - 370.00 |
0.4832 times |
DMA SMA EMA moving averages of Mmp Industries MMP
DMA (daily moving average) of Mmp Industries MMP
| DMA period | DMA value | | 5 day DMA | 269.37 | | 12 day DMA | 266.71 | | 20 day DMA | 271.52 | | 35 day DMA | 274.93 | | 50 day DMA | 275.12 | | 100 day DMA | 273.04 | | 150 day DMA | 266.05 | | 200 day DMA | 268.61 | EMA (exponential moving average) of Mmp Industries MMP
| EMA period | EMA current | EMA prev | EMA prev2 | | 5 day EMA | 272.27 | 267.35 | 263.32 | | 12 day EMA | 270.13 | 267.96 | 266.61 | | 20 day EMA | 270.92 | 269.74 | 269.14 | | 35 day EMA | 271.33 | 270.7 | 270.42 | | 50 day EMA | 272.42 | 272.02 | 271.88 |
SMA (simple moving average) of Mmp Industries MMP
| SMA period | SMA current | SMA prev | SMA prev2 | | 5 day SMA | 269.37 | 267.05 | 264.55 | | 12 day SMA | 266.71 | 266.37 | 266.18 | | 20 day SMA | 271.52 | 271.19 | 271.39 | | 35 day SMA | 274.93 | 274.85 | 274.86 | | 50 day SMA | 275.12 | 274.53 | 273.83 | | 100 day SMA | 273.04 | 272.69 | 272.4 | | 150 day SMA | 266.05 | 265.79 | 265.47 | | 200 day SMA | 268.61 | 268.86 | 269.08 |
|
|
