MittalLife MITTAL full analysis,charts,indicators,moving averages,SMA,DMA,EMA,ADX,MACD,RSIMittal Life MITTAL WideScreen charts, DMA,SMA,EMA technical analysis, forecast prediction, by indicators ADX,MACD,RSI,CCI NSE stock exchange
operates under REAL_ESTATE_INVESTMENT_TRUST sector
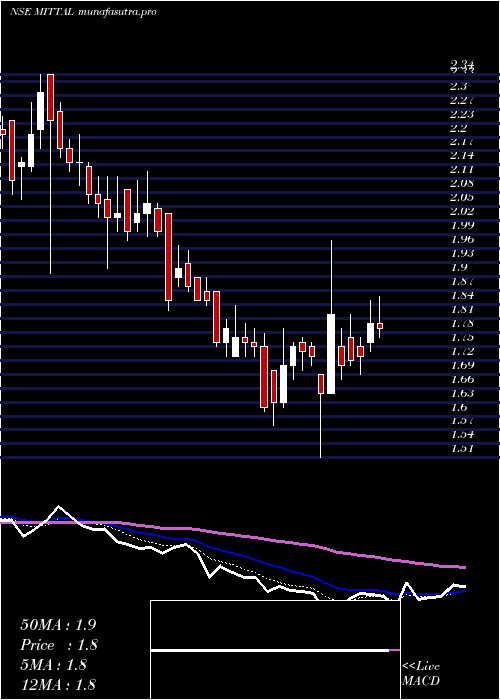
Daily price and charts and targets MittalLife Strong Daily Stock price targets for MittalLife MITTAL are 1.45 and 1.51 | Daily Target 1 | 1.43 | | Daily Target 2 | 1.45 | | Daily Target 3 | 1.4866666666667 | | Daily Target 4 | 1.51 | | Daily Target 5 | 1.55 |
Daily price and volume Mittal Life
| Date |
Closing |
Open |
Range |
Volume |
Wed 29 October 2025 |
1.48 (-0.67%) |
1.48 |
1.46 - 1.52 |
2.8641 times |
Tue 28 October 2025 |
1.49 (-1.32%) |
1.50 |
1.47 - 1.52 |
2.0477 times |
Mon 27 October 2025 |
1.51 (2.03%) |
1.49 |
1.49 - 1.52 |
0.9513 times |
Fri 24 October 2025 |
1.48 (-1.99%) |
1.50 |
1.48 - 1.52 |
0.4243 times |
Thu 23 October 2025 |
1.51 (0%) |
1.53 |
1.50 - 1.53 |
0.551 times |
Tue 21 October 2025 |
1.51 (1.34%) |
1.47 |
1.47 - 1.52 |
0.1651 times |
Mon 20 October 2025 |
1.49 (1.36%) |
1.47 |
1.46 - 1.52 |
0.7145 times |
Fri 17 October 2025 |
1.47 (-1.34%) |
1.48 |
1.46 - 1.49 |
1.0829 times |
Thu 16 October 2025 |
1.49 (-0.67%) |
1.50 |
1.48 - 1.50 |
0.6341 times |
Wed 15 October 2025 |
1.50 (-1.32%) |
1.53 |
1.49 - 1.53 |
0.5649 times |
Tue 14 October 2025 |
1.52 (-0.65%) |
1.52 |
1.51 - 1.54 |
0.5809 times |
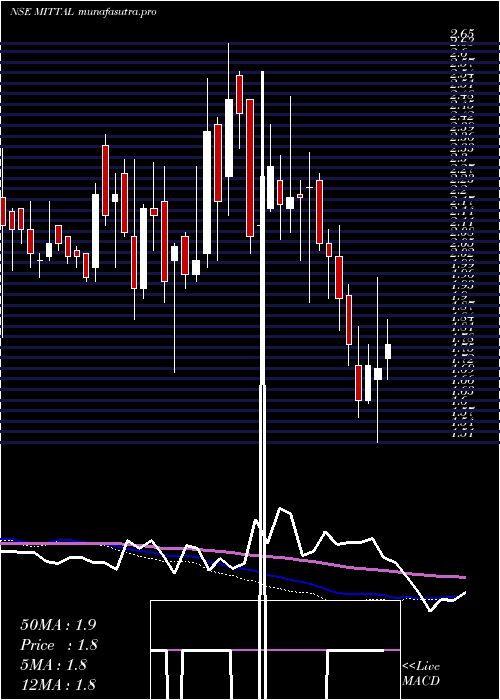
Weekly price and charts MittalLife Strong weekly Stock price targets for MittalLife MITTAL are 1.44 and 1.5 | Weekly Target 1 | 1.43 | | Weekly Target 2 | 1.45 | | Weekly Target 3 | 1.4866666666667 | | Weekly Target 4 | 1.51 | | Weekly Target 5 | 1.55 |
Weekly price and volumes for Mittal Life
| Date |
Closing |
Open |
Range |
Volume |
Wed 29 October 2025 |
1.48 (0%) |
1.49 |
1.46 - 1.52 |
1.1016 times |
Fri 24 October 2025 |
1.48 (0.68%) |
1.47 |
1.46 - 1.53 |
0.3485 times |
Fri 17 October 2025 |
1.47 (-3.29%) |
1.53 |
1.46 - 1.54 |
0.7832 times |
Fri 10 October 2025 |
1.52 (-3.18%) |
1.57 |
1.42 - 1.58 |
2.2942 times |
Fri 03 October 2025 |
1.57 (-1.26%) |
1.60 |
1.56 - 1.62 |
0.6656 times |
Fri 26 September 2025 |
1.59 (-0.63%) |
1.61 |
1.56 - 1.69 |
0.9853 times |
Fri 19 September 2025 |
1.60 (4.58%) |
1.53 |
1.53 - 1.82 |
1.6968 times |
Fri 12 September 2025 |
1.53 (-3.16%) |
1.59 |
1.53 - 1.60 |
0.7867 times |
Fri 05 September 2025 |
1.58 (-1.86%) |
1.57 |
1.56 - 1.63 |
0.4481 times |
Fri 29 August 2025 |
1.61 (-2.42%) |
1.65 |
1.53 - 1.68 |
0.8901 times |
Fri 22 August 2025 |
1.65 (2.48%) |
1.62 |
1.61 - 1.72 |
0.7699 times |
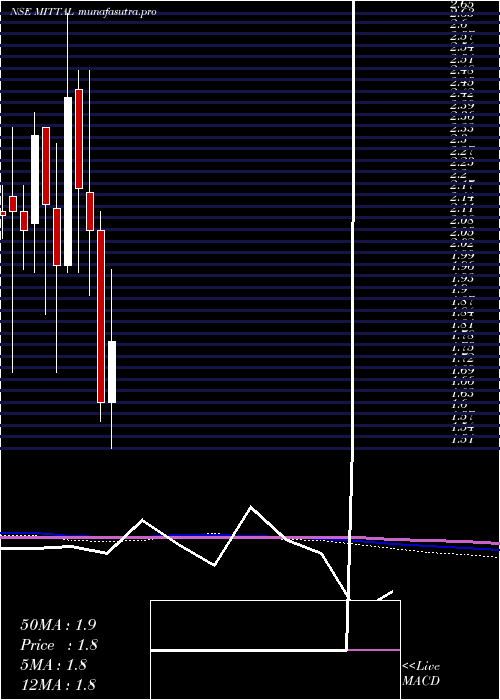
Monthly price and charts MittalLife Strong monthly Stock price targets for MittalLife MITTAL are 1.35 and 1.55 | Monthly Target 1 | 1.31 | | Monthly Target 2 | 1.39 | | Monthly Target 3 | 1.5066666666667 | | Monthly Target 4 | 1.59 | | Monthly Target 5 | 1.71 |
Monthly price and volumes Mittal Life
| Date |
Closing |
Open |
Range |
Volume |
Wed 29 October 2025 |
1.48 (-6.92%) |
1.58 |
1.42 - 1.62 |
0.4297 times |
Tue 30 September 2025 |
1.59 (-1.24%) |
1.57 |
1.53 - 1.82 |
0.355 times |
Fri 29 August 2025 |
1.61 (-6.4%) |
1.72 |
1.53 - 1.74 |
0.2581 times |
Thu 31 July 2025 |
1.72 (11.69%) |
1.54 |
1.52 - 1.83 |
0.8527 times |
Mon 30 June 2025 |
1.54 (-4.94%) |
1.62 |
1.42 - 1.64 |
0.752 times |
Fri 30 May 2025 |
1.62 (-3.57%) |
1.69 |
1.54 - 1.74 |
0.5425 times |
Wed 30 April 2025 |
1.68 (3.07%) |
1.63 |
1.51 - 1.98 |
1.3111 times |
Fri 28 March 2025 |
1.63 (-21.63%) |
2.08 |
1.58 - 2.13 |
1.6711 times |
Fri 28 February 2025 |
2.08 (-5.02%) |
2.18 |
1.91 - 2.50 |
1.5225 times |
Fri 31 January 2025 |
2.19 (-9.88%) |
2.45 |
1.97 - 2.50 |
2.3052 times |
Tue 31 December 2024 |
2.43 (22.11%) |
1.99 |
1.97 - 2.65 |
6.8195 times |
DMA SMA EMA moving averages of Mittal Life MITTAL
DMA (daily moving average) of Mittal Life MITTAL
| DMA period | DMA value | | 5 day DMA | 1.49 | | 12 day DMA | 1.5 | | 20 day DMA | 1.51 | | 35 day DMA | 1.54 | | 50 day DMA | 1.56 | | 100 day DMA | 1.6 | | 150 day DMA | 1.62 | | 200 day DMA | 1.75 | EMA (exponential moving average) of Mittal Life MITTAL
| EMA period | EMA current | EMA prev | EMA prev2 | | 5 day EMA | 1.49 | 1.5 | 1.5 | | 12 day EMA | 1.51 | 1.51 | 1.51 | | 20 day EMA | 1.53 | 1.53 | 1.53 | | 35 day EMA | 1.56 | 1.56 | 1.56 | | 50 day EMA | 1.58 | 1.58 | 1.58 |
SMA (simple moving average) of Mittal Life MITTAL
| SMA period | SMA current | SMA prev | SMA prev2 | | 5 day SMA | 1.49 | 1.5 | 1.5 | | 12 day SMA | 1.5 | 1.5 | 1.5 | | 20 day SMA | 1.51 | 1.52 | 1.52 | | 35 day SMA | 1.54 | 1.54 | 1.54 | | 50 day SMA | 1.56 | 1.57 | 1.57 | | 100 day SMA | 1.6 | 1.6 | 1.6 | | 150 day SMA | 1.62 | 1.62 | 1.63 | | 200 day SMA | 1.75 | 1.75 | 1.76 |
|
|
