MitconConsult MITCON full analysis,charts,indicators,moving averages,SMA,DMA,EMA,ADX,MACD,RSIMitcon Consult MITCON WideScreen charts, DMA,SMA,EMA technical analysis, forecast prediction, by indicators ADX,MACD,RSI,CCI NSE stock exchange
Daily price and charts and targets MitconConsult Strong Daily Stock price targets for MitconConsult MITCON are 68.88 and 74.69 | Daily Target 1 | 67.72 | | Daily Target 2 | 70.03 | | Daily Target 3 | 73.526666666667 | | Daily Target 4 | 75.84 | | Daily Target 5 | 79.34 |
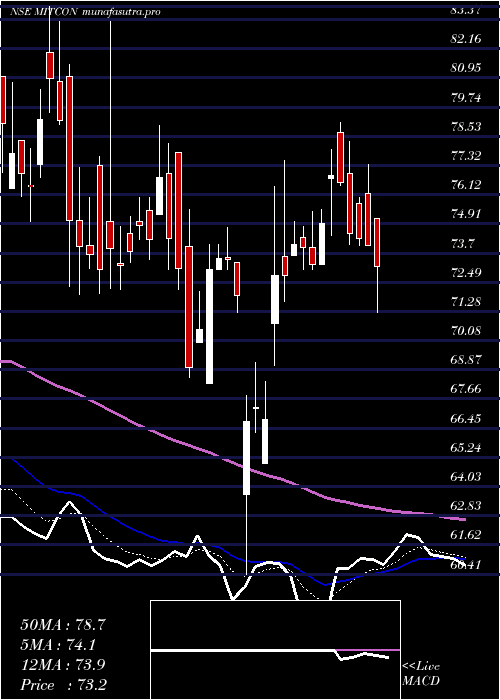
Daily price and volume Mitcon Consult
| Date |
Closing |
Open |
Range |
Volume |
Tue 28 October 2025 |
72.35 (-4.36%) |
75.65 |
71.21 - 77.02 |
0.5448 times |
Mon 27 October 2025 |
75.65 (0.34%) |
76.00 |
75.02 - 78.99 |
0.4805 times |
Fri 24 October 2025 |
75.39 (2.43%) |
74.60 |
73.60 - 83.80 |
3.978 times |
Thu 23 October 2025 |
73.60 (-3.41%) |
74.99 |
70.51 - 81.65 |
2.9812 times |
Tue 21 October 2025 |
76.20 (17.28%) |
64.97 |
64.00 - 77.96 |
1.743 times |
Mon 20 October 2025 |
64.97 (-2.17%) |
66.42 |
64.00 - 67.80 |
0.0316 times |
Fri 17 October 2025 |
66.41 (0.33%) |
68.90 |
66.15 - 68.90 |
0.0263 times |
Thu 16 October 2025 |
66.19 (3.73%) |
64.99 |
62.85 - 67.79 |
0.1296 times |
Wed 15 October 2025 |
63.81 (-2.65%) |
67.19 |
63.30 - 67.19 |
0.0631 times |
Tue 14 October 2025 |
65.55 (-1.72%) |
67.21 |
65.03 - 67.21 |
0.0219 times |
Mon 13 October 2025 |
66.70 (-0.1%) |
68.00 |
66.00 - 68.00 |
0.0494 times |
Weekly price and charts MitconConsult Strong weekly Stock price targets for MitconConsult MITCON are 67.89 and 75.67 | Weekly Target 1 | 66.4 | | Weekly Target 2 | 69.38 | | Weekly Target 3 | 74.183333333333 | | Weekly Target 4 | 77.16 | | Weekly Target 5 | 81.96 |
Weekly price and volumes for Mitcon Consult
| Date |
Closing |
Open |
Range |
Volume |
Tue 28 October 2025 |
72.35 (-4.03%) |
76.00 |
71.21 - 78.99 |
0.4951 times |
Fri 24 October 2025 |
75.39 (13.52%) |
66.42 |
64.00 - 83.80 |
4.2178 times |
Fri 17 October 2025 |
66.41 (-0.54%) |
68.00 |
62.85 - 68.90 |
0.1402 times |
Fri 10 October 2025 |
66.77 (-4.78%) |
69.70 |
66.00 - 71.58 |
0.1909 times |
Fri 03 October 2025 |
70.12 (5.41%) |
68.17 |
66.12 - 70.50 |
0.3773 times |
Fri 26 September 2025 |
66.52 (2.5%) |
66.80 |
65.85 - 74.09 |
1.0465 times |
Fri 19 September 2025 |
64.90 (-0.2%) |
65.79 |
63.99 - 66.99 |
0.6781 times |
Fri 12 September 2025 |
65.03 (-6.78%) |
70.88 |
64.50 - 70.99 |
1.0298 times |
Fri 05 September 2025 |
69.76 (-3.47%) |
74.00 |
68.24 - 74.00 |
0.3752 times |
Fri 29 August 2025 |
72.27 (3.88%) |
69.50 |
68.00 - 78.10 |
1.449 times |
Fri 22 August 2025 |
69.57 (-1.71%) |
71.50 |
68.76 - 74.40 |
0.4944 times |
Monthly price and charts MitconConsult Strong monthly Stock price targets for MitconConsult MITCON are 67.6 and 88.55 | Monthly Target 1 | 52.05 | | Monthly Target 2 | 62.2 | | Monthly Target 3 | 73 | | Monthly Target 4 | 83.15 | | Monthly Target 5 | 93.95 |
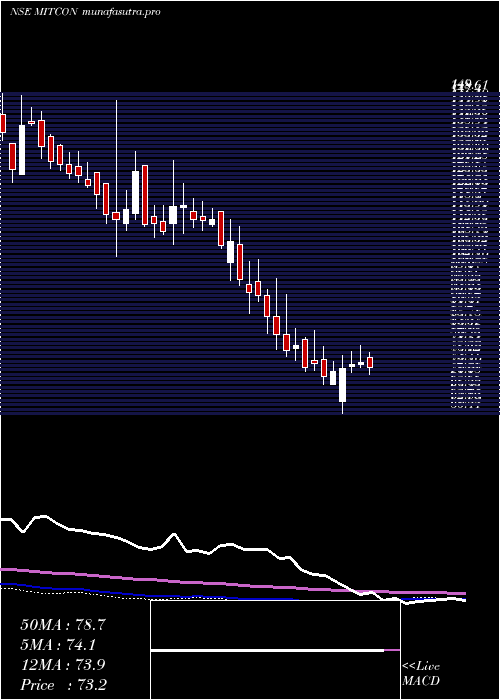
Monthly price and volumes Mitcon Consult
| Date |
Closing |
Open |
Range |
Volume |
Tue 28 October 2025 |
72.35 (7.94%) |
67.78 |
62.85 - 83.80 |
1.6513 times |
Tue 30 September 2025 |
67.03 (-7.25%) |
74.00 |
63.99 - 74.09 |
1.0734 times |
Fri 29 August 2025 |
72.27 (-7.91%) |
79.77 |
68.00 - 83.49 |
0.9481 times |
Thu 31 July 2025 |
78.48 (-8.45%) |
87.50 |
75.30 - 93.18 |
0.9308 times |
Mon 30 June 2025 |
85.72 (1.79%) |
84.64 |
79.11 - 90.23 |
0.9735 times |
Fri 30 May 2025 |
84.21 (15.1%) |
73.99 |
69.21 - 97.62 |
1.9624 times |
Wed 30 April 2025 |
73.16 (3.73%) |
68.30 |
60.41 - 79.11 |
0.3186 times |
Fri 28 March 2025 |
70.53 (-9.37%) |
78.37 |
68.55 - 83.89 |
0.8523 times |
Fri 28 February 2025 |
77.82 (-17.19%) |
97.00 |
76.19 - 102.90 |
0.6793 times |
Fri 31 January 2025 |
93.97 (-17.2%) |
113.84 |
88.00 - 117.19 |
0.6101 times |
Tue 31 December 2024 |
113.49 (2.51%) |
112.96 |
107.20 - 130.22 |
2.2591 times |

DMA SMA EMA moving averages of Mitcon Consult MITCON
DMA (daily moving average) of Mitcon Consult MITCON
| DMA period | DMA value | | 5 day DMA | 74.64 | | 12 day DMA | 69.47 | | 20 day DMA | 68.91 | | 35 day DMA | 67.77 | | 50 day DMA | 68.69 | | 100 day DMA | 74.81 | | 150 day DMA | 75.06 | | 200 day DMA | 78.9 | EMA (exponential moving average) of Mitcon Consult MITCON
| EMA period | EMA current | EMA prev | EMA prev2 | | 5 day EMA | 73.04 | 73.38 | 72.24 | | 12 day EMA | 70.92 | 70.66 | 69.75 | | 20 day EMA | 69.81 | 69.54 | 68.9 | | 35 day EMA | 69.4 | 69.23 | 68.85 | | 50 day EMA | 69.53 | 69.41 | 69.16 |
SMA (simple moving average) of Mitcon Consult MITCON
| SMA period | SMA current | SMA prev | SMA prev2 | | 5 day SMA | 74.64 | 73.16 | 71.31 | | 12 day SMA | 69.47 | 68.96 | 68.31 | | 20 day SMA | 68.91 | 68.62 | 68.23 | | 35 day SMA | 67.77 | 67.7 | 67.55 | | 50 day SMA | 68.69 | 68.71 | 68.63 | | 100 day SMA | 74.81 | 74.91 | 74.97 | | 150 day SMA | 75.06 | 75.07 | 75.05 | | 200 day SMA | 78.9 | 79.1 | 79.3 |
|
|
